Let's talk about the Relative Strength Index (RSI) – a vital tool in the arsenal of any seasoned trader. Whether you're into forex, stocks, or crypto trading, the RSI trading strategy is a reliable go-to for any trader. In this detailed guide, we will delve into the mechanics of the RSI trading strategy, discuss how to interpret it across various markets, timeframes and market seasons, and examine how to leverage it to boost your trading performance.
Unpacking the RSI Indicator
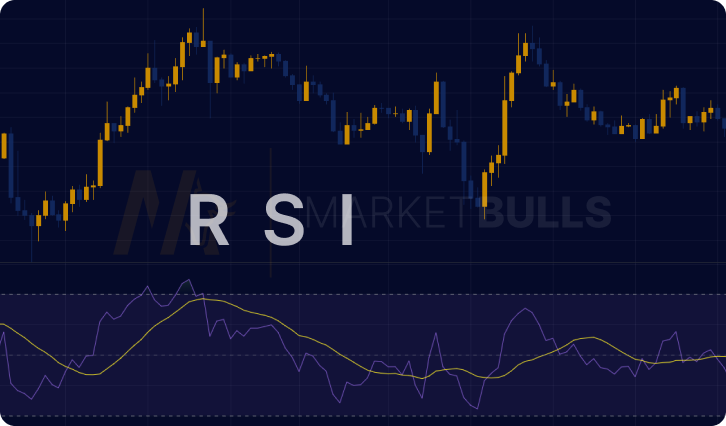
The RSI, or Relative Strength Index, is a momentum oscillator developed by J. Welles Wilder. It measures the velocity and magnitude of price movements, oscillating between zero and 100. The RSI is used to identify overbought or oversold market conditions, detect divergence signals, and decipher the overall trend.
The Formula for Calculating the RSI
RSI is computed using the formula: RSI = 100 – 100/(1 + RS), where RS denotes the average gain divided by the average loss over a specific period, typically 14 periods.
Decoding the RSI
RSI values of 70 or above hint at an overbought or overvalued condition, suggesting a possible trend reversal or price pullback. Conversely, an RSI reading of 30 or below signifies an oversold or undervalued condition.
The RSI Trading Strategy: The Heart of the Matter
The RSI Trading Strategy hinges on the principle of "mean reversion" – the concept that an asset's price will, over time, gravitate back to its average price. This strategy employs RSI to pinpoint when a market could be considered overbought or oversold, thereby offering potential trading opportunities.
RSI in Forex and Stock Markets
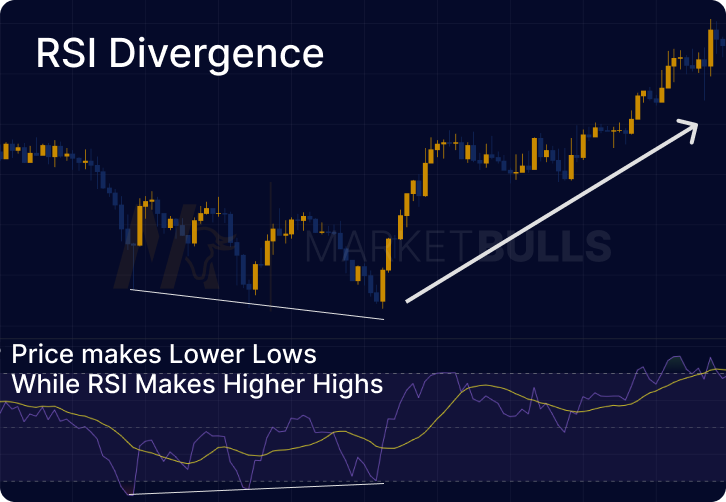
In forex and stock markets, the RSI is a trusted ally to confirm trend formations and to identify overbought and oversold states. Traders look for bullish divergence when a new low in an asset price is not accompanied by a new low in RSI, indicating a possible price reversal.
RSI in Crypto
In the turbulent world of crypto trading, the RSI proves to be a dependable tool. The 24/7 open market allows the RSI to provide continuous data, enabling traders to make informed decisions. A typical crypto RSI strategy could involve waiting for the RSI to enter and subsequently exit the overbought territory before executing a trade.
Divergence in RSI
In the RSI trading strategy, divergence – whether bullish or bearish – is a pivotal concept. Bullish divergence occurs when the asset price registers new lows while the RSI starts to climb, indicating a potential uptrend. On the other hand, a bearish divergence is when the price hits new highs while the RSI descends, signaling a potential downtrend.
RSI Settings for Optimal Results
The standard RSI setting is 14 on close, optimized for trending conditions. However, depending on your trading style and needs, these settings can be tweaked. Some traders prefer a shorter period, like a 9-period RSI, for generating more trading signals.
The RSI Trading Strategy in Action
Implementing the RSI trading strategy entails these steps:
- Ascertain the market condition: Trending or range-bound?
- Spot divergence: This is when price and RSI trajectories differ, signaling a potential price reversal.
- Wait for confirmation: Confirmation can come from price action or another technical indicator.
- Set entry, stop loss, and take profit levels: Always have a clear plan for every trade.

Top Strategies for RSI Trading
Several strategies pivot around the RSI indicator. Here are some notable ones:
- RSI Divergence Strategy: This strategy banks on divergence between price and the RSI.
- RSI Overbought/Oversold Strategy: This strategy involves waiting for the RSI to go above 70 (overbought) or below 30 (oversold) and then exit these levels before initiating a trade.
- RSI Trendline Break Strategy: Traders draw a trendline on the RSI and look for situations where the trendline is breached.
- RSI 50 Centerline Crossover Strategy: Some traders use the level 50 to gauge if the overall trend is bullish or bearish.
Pros and Cons of Using RSI Trading Strategy
Pros:
Versatile and Universal: The RSI is a universal indicator that can be used in any market, be it stocks, forex, or crypto.
Overbought and Oversold Indication: It helps traders determine overbought and oversold conditions, allowing them to make informed decisions about market entries and exits.
Divergence Detection: RSI is particularly useful in spotting divergences – a situation where price and RSI trajectories differ, signaling a potential price reversal.
Trend Identification: The RSI can help identify if a particular asset is in a bullish or bearish trend, thus helping traders align their trades with the ongoing trend.
Cons:
False Signals: Like any technical indicator, the RSI can generate false signals, particularly in volatile markets.
Not Foolproof: The RSI is not always accurate in predicting market reversals. Prices can remain overbought or oversold for a long time, and divergences do not always lead to reversals.
Not a Standalone Tool: While the RSI can provide valuable insight, it should not be used in isolation. It's best used in conjunction with other technical analysis tools and indicators, like EMA or OBV.
Lagging Indicator: The RSI is a lagging indicator, meaning it follows price action. It might not be the best tool for predicting future market movements.
Last Word
Mastering the RSI Trading Strategy can significantly enhance your trading performance. By comprehending the RSI workings and applying it wisely, you can indeed make the most of your trading ventures.
FAQs
RSI stands for Relative Strength Index, a momentum oscillator that measures price movements’ speed and change.
The RSI is computed using the formula: RSI = 100 – 100/(1 + RS), where RS = Average Gain / Average Loss.
The RSI is used to identify overbought or oversold conditions, spot divergence signals, and understand the overall market trend.
An RSI of 70 or above signifies that a security is becoming overbought or overvalued and may indicate a trend reversal or price correction.
The RSI trading strategy involves identifying the market condition, looking for divergence, waiting for confirmation, and setting entry, stop loss, and take profit levels.
Some of the best strategies for RSI trading include the RSI Divergence Strategy, the RSI Overbought/Oversold Strategy, the RSI Trendline Break Strategy, and the RSI 50 Centerline Crossover Strategy.
Yes, the RSI settings can be adjusted according to your trading requirements. Some traders use a shorter period, like a 9-period RSI, to generate more trading signals.
Yes, the RSI is a reliable tool in crypto trading. The continuous open market allows the RSI to provide a continuous stream of useful data.


