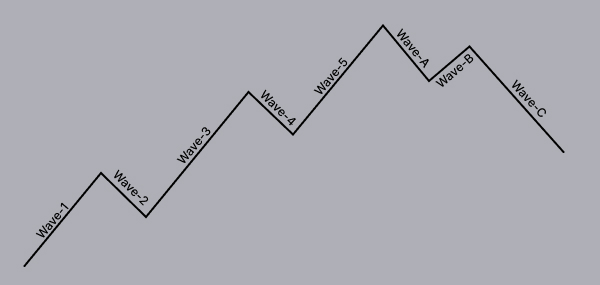
Elliot Wave Calculator with Graph

Elliot Impulse and Corrective Waves

Impulsive Waves

Wave-1

Wave-2

Wave-3

Wave-4

Wave-5

0.00

0.00

0.00

0.00

0.00

0.00

0.00

0.00

0.00

0.00

Corrective Waves

Wave-A

Wave-B

Wave-C

0.00

0.00

0.00

0.00

0.00

0.00

Elliot Uptrend Downtrend Wave Graph

elliot-wave-uptrend-downtrend-impulse-correction-calculator

0.00

0.00

0.00

0.00

0.00

0.00

0.00

0.00

0.00

How to trade Elliot Wave Points

Go Long at / above 0 | Stoploss at 0 | Target 1 is 0

Go Long at / above 0 | Stoploss at 0 | Target 2 is 0

Go Long at / above 0 | Stoploss at 0 | Target 3 is 0

Go Short at / below 0 | Stoploss at 0 | Target 1 is 0

Go Short at / below 0 | Stoploss at 0 | Target 2 is 0

Elliot Wave

Guide to Using an Elliot Wave Calculator

In the complex world of financial trading, having precise and reliable tools is a trader’s best ally. Among these, the Elliot Wave Calculator stands out as a pivotal resource for technical analysis. This comprehensive guide is designed to enhance your understanding of Elliot Wave Sage and how to leverage our state-of-the-art calculator for optimal trading strategy formulation.

Understanding Elliot Wave Theory

At the heart of market psychology and technical analysis lies the Elliot Wave Theory, introduced by Ralph Nelson Elliot in the 1930s. This theory posits that stock market prices unfold in specific patterns, referred to as “waves,” which traders can anticipate and capitalize on.

The theory is structured around two types of waves: Impulse and Corrective. Impulse waves consist of five sub-waves that move in the same direction as the trend, while corrective waves have three sub-waves moving against it.

Elliot Impulse Wave Calculation

Impulse waves, marked as Waves 1, 2, 3, 4, and 5, propel the market in its prevailing trend direction. Calculating these waves is pivotal for traders seeking to ride the momentum. Our Elliot Wave Calculator simplifies this process, using the Elliot Wave calculation formula to accurately project potential price points in a trending market.

Elliot Corrective Waves Calculation

Conversely, corrective waves (labeled as Waves A, B, and C) signify a temporary break or pullback in the market’s predominant trend. Our calculator provides a meticulous analysis, enabling traders to foresee retracements and adjust their positions accordingly.

Elliot Wave Calculator: Step by Step

Our Elliot Wave Calculator is a sophisticated yet user-friendly tool designed to help traders and analysts forecast market trends based on Elliot Wave Theory. Below, we guide you through the process of using the calculator, ensuring that you can interpret the inputs and results for effective trading decisions.

  1. Gather and Input Required Price Points: To begin, you will need three critical price points from the price chart of the asset you are analyzing: High: The highest price reached during a particular time period, Low: The lowest price reached during the same time period, Close: The closing price of the asset for that time period. These values are fundamental as they represent the extreme ranges and the final price that will be used as a benchmark for calculating wave patterns. Once you have these values, input them into the designated fields on our Elliot Wave Calculator
  2. Define the Trend Direction: Before calculation, you must define the prevailing trend direction of the market. Up/Down Trend Selector: Choose whether the asset is currently in an uptrend or downtrend. This will affect the calculation of impulse and corrective waves.
  3. Calculate the Waves: With the data entered and the trend direction selected, you’re ready to perform the calculation. The calculator applies the Elliot Wave calculation formula to your inputs.

Understanding the Results

Impulse Waves Output

The results for impulse waves are displayed, corresponding to Waves 1 through 5:

  • Wave 1: Often the weakest and shortest wave, signaling the start of a new trend.
  • Wave 2: A retracement of Wave 1, not surpassing the start of Wave 1.
  • Wave 3: Typically the longest and most robust wave, pushing prices further in the trend direction.
  • Wave 4: Another retracement that does not overlap with the price territory of Wave 1.
  • Wave 5: The final push, often exhibiting signs of exhaustion in the trend.

Corrective Waves Output

Corrective waves are presented for Waves A, B, and C:

  • Wave A: The initial correction wave against the trend.
  • Wave B: A partial retracement of Wave A, which can sometimes mimic the trend, causing confusion.
  • Wave C: The final wave that usually extends beyond the end of Wave A.

For an easier understanding you can see all waves and price points in the elliot wave result graph.

FAQ

What is an Elliot Wave Calculator?

An Elliot Wave Calculator is a specialized tool that applies Elliot Wave Theory to predict future market movements.

How do you calculate Elliot Waves?

To calculate Elliot Waves, identify the high, low, and close price points of the market movement, determine the trend direction, and input these into the calculator.

What is the Elliot impulse wave calculation?

The Elliot impulse wave calculation predicts the trajectory of market prices during a trend, based on the five-wave pattern.

How do Elliot corrective waves calculation work?

Elliot corrective waves calculation involves anticipating retracements in the market using the three-wave corrective pattern.

Does the Elliot Wave Theory work during market volatility?

Yes, but it’s crucial to account for increased unpredictability during such periods.