Seasonality Charts
Seasonal Tendency Charts for Seasonal Trading
MarketBulls provides you extreme precised seasonal data with all charts and insights you need for seasonal trading. You can use the seasonal heatmap and analyse a particular market indepth with the MarketBulls seasonal analysis-tool.
Monthly Performance Heatmap
*Click the market symbol to draw the chart and get the market specific insights!
| Market | Range | Jan | Feb | Mar | Apr | Mai | Jun | Jul | Aug | Sep | Oct | Nov | Dec |
|---|
Seasonal Tendencies
What are Seasonal Charts and Tendencies?
Seasonal tendencies give a general indication of how different markets perform within specific time periods. This can be periods within a year, a month or a week. Each seasonal trend has specific causes. However, the actual cause of a seasonality is secondary. More important are the understanding and recognition of a seasonal movement. MarketBulls offers you a comprehensive analysis tool for seasonal charts. A seasonal chart shows the average price change over a specific time range. That allows you to recognize seasonal movements at an early stage and implement them in your trading.
MarketBulls Analytics
MarketBulls Seasons Tendency Charts
MarketBulls provides you extremely precise seasonal data, which is calculated by a complex in-house algorithm. With seasonal calculations on the latest 20 years, 15 years, 10 years, 5 years and 2 years you are able to compare and combine different seasonal ranges to find seasonal trends that are really taking place over multiple time-ranges. Because we were able to create really precise seasonal charts, you can use our intra-month seasonal view to find the perfect entry to the day.
How Seasons affect the Markets
Seasonal tendencies can have a wide variety of causes. Keep in mind that it is important to find specific seasonals for specific markets. No matter what the cause of a seasonal market movement is, you can identify and specify the seasonal trend with our seasonal charts.
Here are some typical examples for different market seasons:
January Bull
The stock market can perform well in the beginning of the year. Fresh money can push the prices. January is also seen as a volatile season, which can show the market directions for the year. The saying “As goes January, so goes the year” sums it up.
Holidays
Stock prices can start to rally before the holidays. The reasons are typically optimism and the assumption that consumers are spending more money in the holiday seasons, especially on Christmas holidays.
End of the Year Rebalance
At the end of the year institutional investors can rebalance their portfolio. With that, some losses getting cut and some profits taken. Markets that rallied can start to rebalance as these traders are taking some profits and closing some long positions. That also applies the other way around on bearish markets. The seasonal rebalancing can also appear on quarterly endings.
Sell in May and go away
As the bigger institutions go on holidays in the summer, it is believed that they sell some portions of their holdings before around may. With that the institutions are managing their risk on bigger market moves, when they can not act quickly. The summer season can last until September.
Be aware that these examples are typical assumptions. Seasonal tendencies should be analyzed market specific and based on the price changes in the last 20, 15, 10, 5 & 2 years.
Seasonal Tendencies
Seasonal Trading Strategy – Forex Example
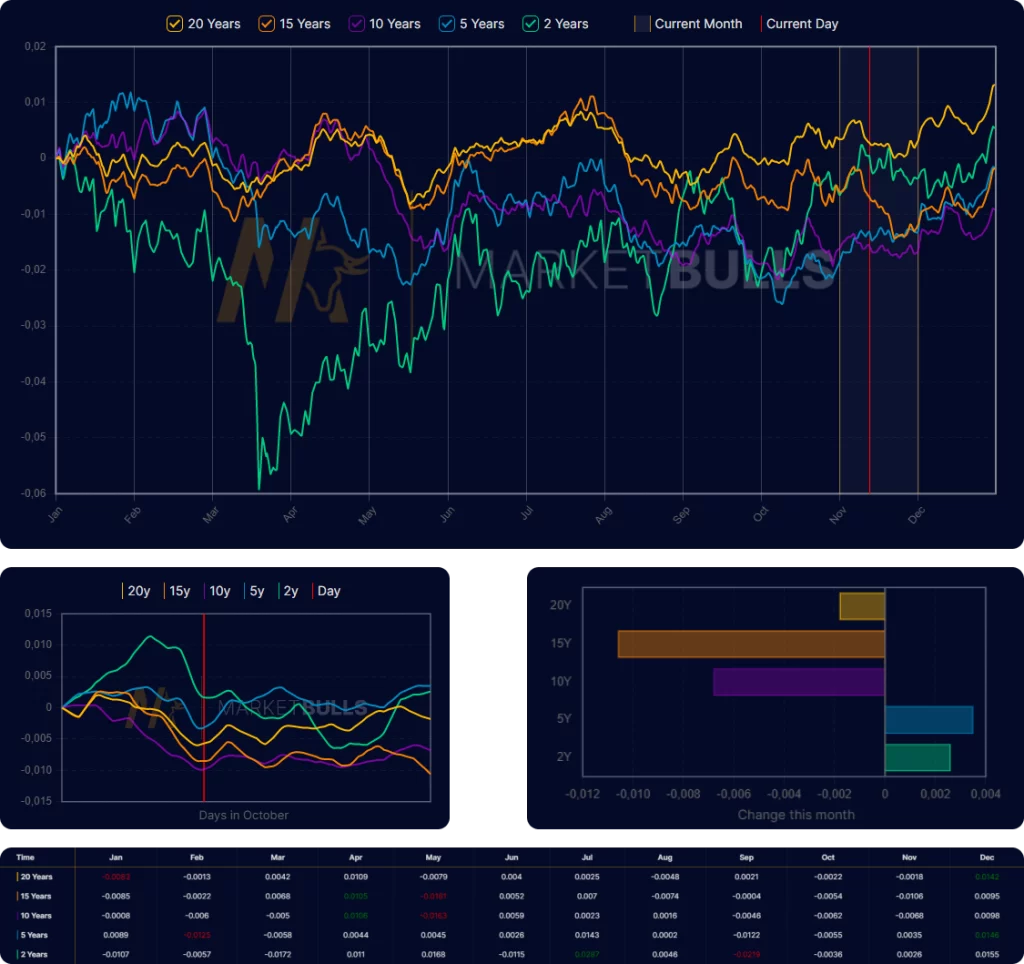
With MarketBulls seasonal charts you can trade seasonal tendencies on their own or confirm trading and investment ideas as we recommend. In the following you can see a typical forex seasonal chart, which you can find in our analysis-tool.
Identify Patterns and Trends
First of all, you should check the 20-year seasonal graph. In this case you can directly see that January has been bearish over the last 20 years. From mid February until the beginning of August this seasonal forex chart shows a bullish seasonal. The next bullish season starts mid November until the year ends. You can use these seasonal tendencies to underline trading ideas and entry planning in these times. But not only that. Maybe in the first week of May you want to take a short trade on the pair. In the beginning of May, there is a clear down move in price on average over the last 20 years. That is a clear confirmation to take a lower risk short trade at that specific time.

You can then start to use the lower time range seasonal data for that forex pair to get even more insights. Let’s take a look at our short trade in the beginning of May again. Looking at all time ranges in the section below, you can see that the down move appears over all of them. Even over the last 2 years, where May ended bullish, there was a clear down move in the beginning before the rally.
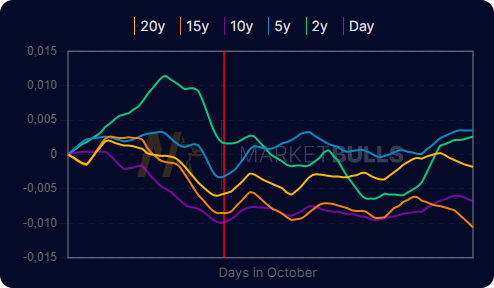
Specify Intra-Month & Compare
As we see in the forex seasonal chart, there is a clear bullish season in December for that pair. By that we could take a long position just at the beginning of the month. Another possibility is to benefit from the whole seasonal move, which starts in the second week of November. You can use the intra-month tool to take a deeper look into the current month which is November in this case. There we clearly see that we should start to look for long positions after the first third of November.
With the MarketBulls monthly seasonal overview you can find clearly bullish or bearish months fast and without any background on the causes. In the forex example we should take long positions in April, Juli & December. On the other hand, we can look for short opportunities in January, February, September & October.
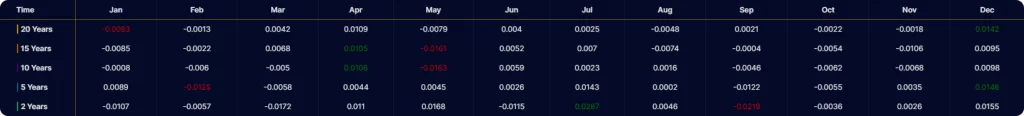
To get an idea of the expected price movement you can calculate the approximate change expectation in pips based on the average price changes over the specified periods. For the seasonal chart example, we could expect a bullish move in December of approximately +0,01272.
Seasonal Insights
Trading Seasonal Tendencies
With our seasonal chart tool we provide very precise data. Keep in mind that all seasonal price movements are based on historical movements. With that we can just expect movements based on historical experiences. That is why we highly recommend trading seasonal tendencies with a clear fundamental understanding and/or chart analysis strategies. A very precise combination is the usage of seasonal tendencies and the COT Report. By combining different trading strategies and looking for confirmations you can higher your win-rate drastically.
