Gann Square of 9 Calculator

Gann Square of 9 Results

000
000
000
0000000
000
000
000

Gann Square of 9 Support & Resistance

Resistance 1Resistance 2Resistance 3Resistance 4Resistance 5
0.000.000.000.000.00
Support 1Support 2Support 3Support 4Support 5
0.000.000.000.000.00

Gann Trading Entries Long/ Short

Buy at / above: 0

Target 1: 0

Target 2: 0

Target 3: 0

Target 4: 0

Stop-Loss: 0

Sell at / below: 0

Target 1: 0

Target 2: 0

Target 3: 0

Target 4: 0

Stop-Loss: 0

Gann Square of Nine

Trading with the Gann Square of 9 Calculator

In the dynamic world of financial markets, where every second can be the difference between profit and loss, traders seek every possible edge to enhance their decision-making. The Gann Square of 9 Calculator emerges as a pivotal tool for those steeped in the study of market trends and patterns. This mystical and mathematical approach to trading, conceived by the legendary W.D. Gann, remains as relevant today as it was a century ago. In this section, we delve into the foundations of Gann’s theory and reveal how the Gann Square of 9 can transform your trading strategies.

Gann Theory and Its Enduring Legacy

William Delbert Gann, a finance trader who developed numerous theories in the field of technical analysis, believed that the stock market could be understood through a combination of geometry, astrology, and ancient mathematics. Among his various inventions, the Gann Square of 9 stands out for its unique ability to predict stock market price movements with a surprising degree of accuracy. The concept revolves around a central value represented by the number 1, with subsequent values unwinding in a spiral. These numbers correlate to time and price and are believed to indicate potential market turning points.

The Gann Square of Nine

The Gann Square of 9 is essentially a grid of numbers that offers a geometrical representation of time and price movements. The calculator, which we feature prominently on our page, serves as a modern-day compass for navigating the complexities of market analysis. It is not just a calculator; it is a window into the cyclical nature of markets, providing traders with resistance and support levels, and insights into when to enter or exit trades. Its grid-like structure allows for the interpretation of numbers as they spiral outward from the center, offering predictions on bullish and bearish market sentiments.

Understande the Gann Square of 9

Discover the enigmatic world of W.D. Gann’s Square of 9, a tool that has captivated traders’ imaginations and analytical skills for generations. As we unfold the secrets of this fascinating square, we will illustrate how our intuitive Gann Square of 9 Calculator can become an indispensable part of your trading arsenal.

Historical Context of the Gann Square of 9

The origins of the Gann Square of 9 are as intriguing as its creator. W.D. Gann, a finance trader from the early 20th century, unveiled a method that proposed a harmonious relationship between time and price. Gann’s methodology, deeply rooted in ancient mathematics and geometry, suggests that financial markets move in predictable cycles, mirrored in the structure of the Square of 9.

Basic Principles of the Gann Square of 9

At its core, the Gann Square of 9 is built on a numerical system that spirals outward from a central point. This spiral arrangement of numbers can be used to identify potential support and resistance levels in the market. Each number in the square represents a potential pivot point or a change in the market direction, hinged upon Gann’s theory of time and price balance.

Utilization of the Gann Square in Market Analysis

The power of the Gann Square of 9 lies in its ability to forecast critical points in the market where significant price movements are likely to occur. By using our Gann Square of 9 Calculator, traders can calculate these pivotal points with ease, applying Gann’s principles to predict market highs and lows. This section would offer readers a glimpse into the practical application of the Gann Square for both short-term and long-term market predictions.

Market Movements with the Gann Square of 9 Calculator

Unlock the mysteries of market timing and price movements with our user-friendly Gann Square of 9 Calculator. This powerful tool encapsulates the essence of W.D. Gann’s trading principles, modernized for today’s financial markets. In this section, we provide a comprehensive guide on how to harness this calculator to enhance your trading decisions.

Navigating the Gann Square of 9 Calculator Interface

When you land on our Gann Square of 9 Calculator page, you’re greeted with a sleek and straightforward interface designed for ease of use. Central to this interface is the input section where you can enter the current Market Price of the asset you’re trading. Accompanying this is the Pip value input, allowing for precise adjustments corresponding to your trading needs.

Step-by-Step Usage:

  1. Enter the Market Price: Locate the ‘Market Price’ field on our calculator. This is the price you want to analyze, usually the closing price of the previous trading day or the current live price.
  2. Adjust the Pip Value: Input the pip value that suits the scale of your trading operations. This value determines the increment used by the calculator to generate the Gann numbers.
  3. Calculate: Hit the ‘Calculate’ button and watch as the calculator generates a series of numbers laid out in the iconic Gann Square of 9 pattern. This grid is your map to potential future price points.
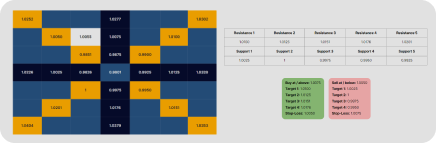
  4. Interpret the Results: The calculator provides you with a visual array of numbers increasing from the center outwards. The central value is your input market price, surrounded by potential resistance and support levels.
  5. Utilize Support and Resistance Data: Below the Gann Square, you’ll find the calculated support and resistance levels. These are instrumental in planning entry and exit points for trades.
  6. Incorporate Gann Trading Entries: At the bottom of the page, specific long and short trading entries are suggested based on the calculations. These include targets and stop-loss points, crucial for risk management.

By following these steps, you can efficiently apply Gann’s time-honored techniques to contemporary markets. Our Gann Square of 9 Calculator not only simplifies complex calculations but also brings a wealth of analytical power to your fingertips, enabling you to make informed trading decisions backed by one of the most influential theories in market analysis.

Whether you’re new to Gann’s methods or a seasoned trader, this calculator is designed to provide valuable insights that align with Gann’s original intent, all while providing a user experience that meets the expectations of modern traders. With just a few clicks, you can transform raw market data into a geometric representation of time and price, paving the way for strategic trading that resonates with the cyclical nature of financial markets.

FAQ

What is a Gann Square of 9 Calculator?

The Gann Square of 9 Calculator is a digital tool based on W.D. Gann’s mathematical and geometric principles for forecasting financial markets. It generates potential support and resistance levels from a given market price and pip value, aligning with Gann’s concept of time and price symmetry.

How does the Gann Square of 9 Calculator work?

You input the current market price and a pip value into the calculator, which then populates a spiral grid of numbers. These numbers represent potential future support and resistance levels, market pivot points, and entry or exit positions for trading.

Can I use the Gann Calculator for all trading markets?

Yes, the Gann Calculator is versatile and can be used across various markets including stocks, commodities, and forex. However, the interpretation of the results may vary depending on market liquidity and volatility.

What is the difference between a Gann level calculator and a Gann square calculator?

A Gann level calculator specifically determines individual Gann levels, often in a linear fashion. A Gann square calculator, like the Square of 9, arranges these levels in a square spiral, providing a broader range of potential price points.

Is the Gann Square of 9 useful for intraday trading?

Yes, the Gann Square of 9 can be highly effective for intraday trading. Traders can use the Gann Square of 9 intraday calculator to forecast intraday pivot points and make quick decisions based on these levels.

What is the process to calculate Gann Square of 9?

To calculate the Gann Square of 9, you start with a central value, typically the market price, and spiral outwards incrementally. Each square or level represents a potential turn in the market. This calculator automates the process, generating the grid based on your input values.

Is there a specific formula for the Gann Square of 9 calculation?

The Gann Square of 9 calculation is based on a fixed formula that incorporates the square root of a given number, adjusts it by adding or subtracting a constant, and then squares the result again to find potential price levels.

Where can I find a Gann Square of 9 calculator for free?

Our website offers a free Gann Square of 9 calculator online. You can access it anytime to assist with your trading decisions without any cost.

How do you calculate Gann numbers?

Gann numbers are calculated by taking the square root of a significant high or low price, adding or subtracting a constant, and then squaring the result to find the next potential pivot point.

Does the Gann Square of 9 work?

Many traders find value in the Gann Square of 9 for identifying potential price targets and reversals. Like any analytical tool, its effectiveness can vary based on market conditions and the trader’s expertise in interpreting the results.

How do Gann pivot points enhance trading decisions?

Gann pivot points serve as indicators for potential market reversals. By identifying these pivot points, traders can make informed decisions about entry and exit points, stop-loss orders, and target prices, potentially enhancing trading performance.