
The Wyckoff Method with its accumulation and distribution schematics is becoming more and more popular for trading these days. While too many non-traders are trying to sell courses on a public knowledge theory without giving any further developments and adjustments to today’s market situation, we decided to create a comprehensive and complete guide on Wyckoff trading for our readers. The following Wyckoff guide will contain all aspects of the Wyckoff method.
Richard D. Wyckoff
Richard Demille Wyckoff lived from 1873 to 1934. He is considered one of the “fathers” of technical market analysis. The Wyckoff market theory is one of the big theories of the financial markets, like the Dow Theory or Elliott Waves, that every active trader should understand.
Wyckoff started his career as a stock exchange marketeer until he became the head of his own company in his mid-20s. On the side, he founded “The Magazine of Wall Street” which he was also writing for.
He always deeply studied the markets and concentrated on the activities of the big trading companies of his time. With his interest in the trading style of the big traders, he started to study their market behavior. Wyckoff brought his results together and managed to bring those into more general laws and principles of the markets. With that, he started to create the Wyckoff methodology, which is until today one of the leading trading methods. This includes the whole market cycle and bringing together the fears and confidence of the general public about a market, combined with the activities of the big investors.
With his new conclusions, he came across market manipulations and the gutting of retail investors. Therefore, he set himself the goal to inform the public and started teaching retail investors the institutional market cycles. With multiple published books and the founding of a trading school in the 1930s, he set the foundations for smart money concepts which we as MarketBulls are trading, further develop and refine today.
Let’s start to take a deeper dive into the Wyckoff Trading Method.
The Composite Man
Wyckoff saw all the reasons the price is moving as one composition. For that, he created the term “Composite Man”. Today most people are speaking from the Market Makers, which has the same foundation. Instead of analysing each big investor, like hedge funds, commercial banks, or central banks, we are combining all those for like one big operator that drives and manipulates the market. It isn’t any secret anymore, that the large operators are manipulating the markets and seeking public liquidity. Our main goal as a trader should be to imitate and trade in line with these large operators or “the composite man”. That’s where technical analysis should have its foundation. Every other trading strategy, no matter if scalping, day trading, or swing trading should have the underlying understanding of what the market makers or composite man are doing.
Wyckoff analysed the markets with that understanding and found correlations that were completely new at that time. We as MarketBulls are carrying on this research continuously and adapting more in-depth systems on today’s financial markets, with around 80% of the trading volume done by AIs.
Wyckoff took all his knowledge and taught it to the public. The Composite Man is continuously planning his order executions. These executions are exactly planned. When the public is attracted to a stock, the institutions are already placed.
The big orders of the Composite Man can’t be executed like a retail order. The big position sizes lead to precise adjustments to his strategy. These adjustments where the Composite Man is “working in” his orders are visible for experienced traders and can be used to get involved in a trend before it starts! While the institutions are placing their orders, manipulation and scaring or attracting the public is the key for the Composite Man to get the big order sizes filled. Don’t think now that it is easy. The Composite Man is doing his work to stay undetected in the positional direction and does everything for it to fool us.
5 Steps of Decision Making
- Determining the present position and probable future trends:
Analyse what the market is doing. Use Wyckoff Analysis and Supply & Demand to identify future trends early or to not participate in the market when it consolidates. - Select in harmony with the trend:
Pick assets that are following a specific trend. Participate in assets that outperform the market and indices. - Select markets with a reasonable cause:
When analysing accumulations or distributions make sure that the cause is large enough to justify a trade. This is where the rule of cause and effect comes into play. - Determine the readiness to move:
Use Wyckoff market cycles to determine a short or long position at the right time. - Time your commitment and be prepared to make adjustments:
Always be in harmony with the market. To make accurate trading decisions in the long run, you need to trade within the flow of the market. This includes changing your positions according to potential market changes.
Wyckoff Market Cycle
For Wyckoff the market was moving in different cycles through supply and demand. These market cycles can be spotted with accurate chart analysis. The Wyckoff market cycle consists of an accumulation area, where price is heavily oversold. Followed by the accumulation price is going for a markup phase. Inside that markup phase, the demand is greater than the supply. The markup period is continuing until the price is overbought. At that time the composite man starts the distribution. The area where price is oversold and is getting distributed, is the distribution area. After the distribution price is going into a markdown. Supply is now greater than demand and price drops. Our job as a trader is to detect accumulation areas and oversold prices to take long positions. On the other hand, we want to close our long positions and start taking short positions as price is overbought and coming into a distribution area.
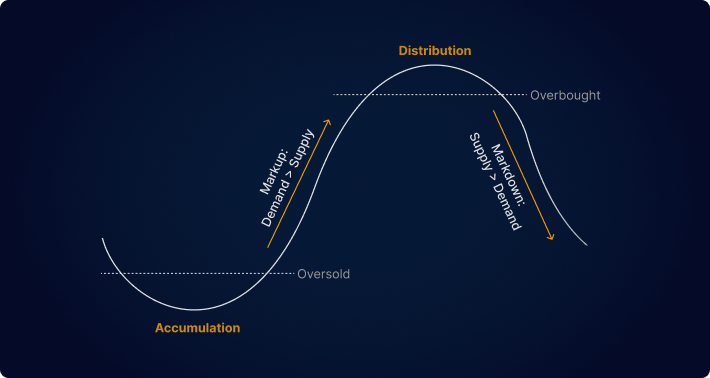
Keep in mind that the markets are fractal. The markdown doesn’t have to take out the earlier accumulation area. Market can still be in a trending environment. That’s where other analysis methods and institutional order flow are important.
With his contacts with large investors and the studying of their market behavior, Wyckoff was able to use chart techniques to understand future market movements. He concentrated on the accumulation and distribution areas to be in the market even before a trend had formed.
Important: To start right away, the Wyckoff market cycles and phases are institutional trading concepts, which are applied to higher time frames! Don’t think that the market makers are playing on the 1 – 15-minute time frames. Of course, you will find manipulations and there are awesome trading methods for smaller time frames, but simply get out of your head that there is an accumulation phase on a 5-minute time frame. Yes, you can spot patterns that are looking like an accumulation or distribution phase, but don’t let the markets fool you! Don’t worry, we will get there. But to trade the smaller time frames, you must understand the higher time frame order flow and the bigger picture of the actual market situation. Therefore, Wyckoff cycles are used for higher time frame swing traders and intraday traders.
The Three Laws of Wyckoff
With his understanding of the market cycle, Wyckoff created his three main laws for market analysis. The Laws contain supply and demand, cause and effect, and effort vs. result.
The three laws of Wyckoff were created to teach retail analysts. The traders can get a deep understanding of identifying future higher time frame directional bias. The laws were created for picking longs and shorts for stocks, but the methods can be used for any other asset classes with the right adjustments. With the three laws, we can identify if the price is ready to leave a specific trading range and aim for specific price targets within a markup or markdown. You can take these laws to pick certain assets, understand the directional bias as well as targeting specific price points.
The Law of Supply and Demand
The first law of the three laws of Wyckoff is probably the most important and popular. The price is rising if demand is greater than supply. On the other hand, the price is falling if supply is greater than demand. Sounds simple at first, but to understand the balance of supply and demand, there is a lot of studying involved. To define the counterplay between supply and demand we must analyse the combination of actual price and volume at certain prices and times. Deeply analysing the volume in combination with price can give a big advantage in finding profitable setups.
The Law of Cause and Effect
We want to get an understanding of prices to target and our trading range with the second of the three laws of Wyckoff. Price is always playing in different trading ranges. When leaving a certain trading range, price will have certain targets as well.
A greater cause will have greater effects on price than a smaller one. This law of nature can be used to define our trading targets.
For the analysis of cause and effect, Wyckoff used Point and Figure charts. However, we recommend the use of fundamental analysis & technical chart analysis to measure price goals and manage an open position.
The Law of Effort vs. Result
The third law of the three laws of Wyckoff is very important while being in a trade. Understanding this law can give us clues about an ending markup or markdown and possible reversals. The law of effort vs. result is going in line with an analysis of volume and price. One of the main things you should look for are divergences between volume and price.
At the end of markup, we can often spot trading ranges that are getting smaller. Normally these shrinking trading ranges are not indicating higher probabilities of reversals. But in combination with rising volumes, you should start to close portions of your position even when the price hasn’t reached all price targets. The end of a trend doesn’t have to end in a reversal. Price can also start to consolidate and go into another accumulation or distribution phase.
In a markup: Shrinking trading ranges, which means smaller expansions to the upside, combined with rising volume to the price movements are indicating a possible end of a trend and possible reversals in the nearer future. Price will start to fail to make higher highs. Big institutions are starting to get rid of their long positions and/ or stacking short positions.
In a markdown: Shrinking trading ranges with smaller expansions to the downside, combined with rising volume to the price movements can indicate an end of a trend and possible future reversals. Price will start failing to make lower lows. The institutions are closing their short positions and/ or stacking long positions.
Overall, the rising volume is a rising effort but ends in shrinking results with smaller trading ranges.
Wyckoff Accumulation & Distribution Schematics
No matter if you are trading stocks, futures, indices, forex, or cryptocurrencies. It is extremely important to know the actual trading and price range. Especially for measuring great risk-to-reward trading opportunities. Trading Ranges are price ranges, where the price is currently moving in. For Wyckoff, a trading range is a range where the last trend had its high & low and supply & demand are in balance or equilibrium. The big market makers are building their positions in these trading ranges and consolidations. Consolidation is a compressed price range, where the price is not able to leave the range for a certain time. The longer price is held in consolidation the greater will be the expansion when the price leaves the range. Again: Higher time in a consolidation (cause) equals a bigger expansion out of the range (effect).
We as a trader must analyse the consolidations very carefully to predict the future direction after the consolidation. Nevertheless, you need to analyse it precisely. The institutions are constantly manipulating these ranges with false breakouts and stop hunts to bring traders on the wrong side and seek their liquidity.
Wyckoff saw consolidations differently, which can occur before a trend or within a trend. A consolidation that ends with a markup and an expansion to the upside is called an accumulation. A consolidation that ends with a markdown and an expansion to the downside is a distribution.
Wyckoff was able to analyse the different consolidations and brought his studies together in the different Wyckoff schematics. These schematics can help us analyse consolidations and predict future directional bias.
To say it again: Wyckoff schematics are not occurring on 1- or 15-minute time frames! We can use the Wyckoff schematics to determine directional bias and trade them as swing trades. Knowing the actual market cycle and directional bias on the weekly, daily, and 4h time frames then gives a day trader or scalper much better trade opportunities intraday. Don’t get fooled by the new generation of traders which are showing you accumulations on a 1m time frame. The institutions are not accumulating their big orders in those time frames! Determine the higher time frame institutional order flow first, to go on the lower time frames with other trading strategies. Don’t worry, we will help you to get there. We want to trade smart money concepts on the higher time frames and combine them with intraday and scalping techniques to define entries. So, let’s get started with the different Wyckoff schematics.
Wyckoff Accumulation Schematic & Pattern
The Wyckoff Accumulation is the event where large institutions (the Composite Man) are accumulating their big long positions for a longer-term future trend. The accumulation mostly appears after a downtrend and ends in a complete market reversal. The accumulation can also appear during an uptrend as a Re-Accumulation to continue the bullish trend after a consolidation. A Wyckoff accumulation schematic describes a stacking of long orders over a certain time. The period can be between some days and multiple weeks. The longer price stays in this consolidation, the greater the effect on price will be in the upcoming bullish market.
Big institutions cannot just buy a stock or other assets for a certain price. If they would just buy into the market aggressively with these big position sizes, they would have to pay higher prices. The market would already move just because of the slippage. Market depth is underlying that.
Let us show a simplified example: The price of a stock is 1$. You want to buy 10 shares of the stock. For every stock you are buying, there must be a seller of the stock. Let’s say 5 shares are offered for 1$. You are getting these 5 shares for 1$, but then there are no sellers that are ready to sell for your price anymore. They are selling at higher prices. 3 shares are offered at 1.1$ and 2 at 1.3$. With an aggressive market order, you would have to have to pay for your 10 shares: 5*1$ + 3*1.1$ + 2*1.3$. So, you paid 10.90$ instead of 10$. At the same time, the price of the stock already rises, because supply and demand are staying in balance. The stock is moving to a higher price when somebody is aggressively buying into the market.
The big institutions are not willing to buy a stock at a higher price, just because they are buying in bigger positions. Here comes the Wyckoff accumulation pattern in play. While the price is held in a certain price range, the market makers are accumulating their longs over a longer time. We can spot this in consolidations. And now comes the interesting part. For accumulating big positions, they need the liquidity of other market participants to fill their long orders inside that consolidation price range. For that, the big institutions are heavily manipulating buyers and sellers in these periods. The more buyers, who would be right with their direction, are getting manipulated out of their long orders, the more long orders can get absorbed by the big institutions. On the other hand, sellers are also getting manipulated. Every seller that is coming into the market is getting filled by the long orders of the market makers.
This consolidation and manipulation are going on until the institutions stacked their long positions. If a trader can spot the accumulation with the manipulation of buyers and sellers, he can trade for a long-term trend in line with the big institutions. The big bullish moves are often following the accumulations.The Wyckoff accumulation schematic 1 contains multiple phases with different events.
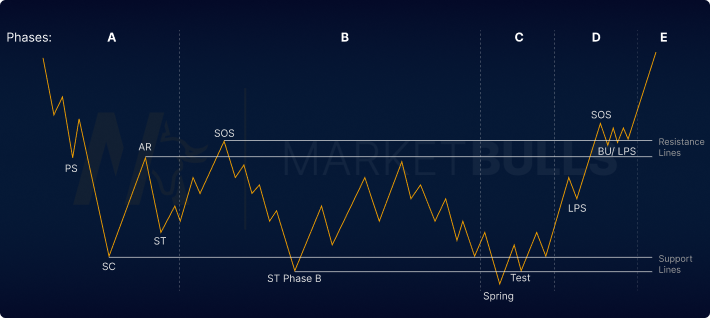
Accumulation Phase A
The Phase A of Wyckoff Accumulation is ending the previous downtrend and bringing price into the consolidation cycle. Up to the Accumulation Phase A, supply has highly exceeded the demand. The first phase shows clearly that supply and demand are changing. The rising demand and or sinking supply is seen mostly in a heavy volume increase and widening spreads.
Phase A consists of 4 main events: Preliminary Support (PS), Selling Climax (SC), Automatic Rally (AR), and Secondary Test (ST).
Preliminary Support (PS)
The Preliminary Support is the first event of Phase A. The PS shows the first signs of support after a longer bearish trend. At the PS the first institutional buyers are joining the market. At the same time, the institutions are starting to close their longer-term short positions. With that, the volume is rising and the spreads are widening. The Preliminary Support shows us the first signs of an ending downtrend. Still, we are not just blindly jumping into long trades. The PS just brings our interest to the market. Now we should be aware of a possible accumulation cycle.
Selling Climax (SC)
The second event of Phase A of the Wyckoff accumulation is the Selling Climax. The SC prints a clear lower low after the PS. It contains still bigger volumes and widening spreads like the PS. The selling pressure is peaking with the SC. The heavy selling pressure is not caused by the institutions. The public is still selling heavily because they are not aware of the upcoming accumulation and the signs of institutional buying. In combination with panic sells the SC is often seen clearly on the chart with a fast increase in price. The institutions are pairing their long-term long orders with the positions by the big number of sellers. The Selling Climax will be near the lowest low of a valid Wyckoff accumulation. It is a fast & clear down move. On a bar chart, the last candle often has a large wick, because of the next event. The Selling Climax will be important for the whole accumulation cycle with all its phases. With the SC we can define our first important support level for the accumulation phase.
Automatic Rally (AR)
After the Selling Climax supply and demand are shifting more and more. The selling pressure already peaked and is now decreasing. At the same time, the institutions increased the buying pressure as well as closed their short positions with the incoming buying interest. With increased demand and decreased supply price is pushing up and defining the AR at the high of the rally. In most cases, the AR should not take out the swing high of the PS. With the Automatic Rally, we can start to refine our trading range for the upcoming phases. The high of the AR is our first level of interest for clear resistance.
Secondary Test (ST)
The Selling Climax and the Automatic Rally price already defined our future support and resistance for the upcoming accumulation cycle. The last event of Phase A is the Secondary Test. After the price created a swing high with the AR it will retest the SC. In our theory demand has increased and supply has decreased. With that, the Selling Climax should hold the price above our support for now. With the Secondary Test closer to our support of the SC, the earlier high volume and spreads should now be depreciated. Important to note: There can be multiple Secondary Tests of our Selling Climax, even before the accumulation goes into Phase B. If the ST would clearly take out the SC low, we should reconsider our markup and stay on the sidelines until we spot our Wyckoff accumulation events.
After the events of Phase A, the downtrend is ending. The market is now going into a consolidation phase. The trading range for the accumulation cycle is now defined by the SC and AR. In these early phases, we do not want to be participants in these market conditions. Yes, we are not trading these conditions, but we are still attentively analysing the market, coming into Phase B.
Accumulation Phase B
Phase B of the Wyckoff Accumulation can last multiple days, even up to a year. The time depends on the position sizes of the institutions and public supply and demand. Now the second Law of Wyckoff gets important again. The longer the accumulation will last and the more orders of the institutions are getting accumulated, the bigger the cause. The markup will be stronger just like the effect of the accumulation.
During Phase B the market makers are accumulating the biggest portions of their log positions for the upcoming markup. The institutions can buy at low prices at that time. Phase B not only contains buying of the institutions. They are also bringing in selling pressure multiple times, to confuse the public and retail traders. That is why Phase B contains multiple Secondary Tests. The STs are mainly testing the support, defined with the Selling Climax of Phase A. Within this Phase price will also test the resistance of the previous AR. Now it’s interesting that the tests can take out the swing points of the SC or AR of Phase A. In that phase of accumulation, the institutions are consistently manipulating the market.
Phase B of an accumulation has multiple STs, but the main event we are waiting for is the “Second Test in Phase B” which can take out the Selling Climax. The multiple bullish actions within Phase B should be noticed, but in that phase, we are not too interested in the up moves. More important are the bearish moves that are manipulating the market now.
The Second Test in Phase B (ST Phase B)
The main event of the accumulation Phase B is the ST Phase B. This Second Test can take out the previously defined Selling Climax. A lot is going on when the price takes out the Selling Climax. Sellers are getting involved again and buyers are losing their confidence. The institutions can fill more and more long orders with the public selling interest. After the Second test in Phase B, price tends to test the upper end of the trading range again. This was defined by the AR and often a test in Phase B that swept the swing high of the AR.
The institutions are interested in seeking the supply to fill their long orders. They are buying and selling in multiple stages to absorb as much supply as possible. The early stage of Phase B can still contain high volume and wider price swings. Within Phase B the volume of the downswings becomes less and less as institutions are seeking more and more supply. When the big institutions absorb enough supply, the accumulation comes to Phase C of the cycle.
Accumulation Phase C
Phase C is a very important phase of the Wyckoff accumulation. Now the price will test the remaining supply. For the upcoming markup, the institutions want to absorb most of the supply. Price is testing the support levels defined by the Selling Climax of Phase A and the Second Test in Phase B. The market makers are testing the upcoming supply and demand at these levels. Now, the different schematics of the Wyckoff Accumulation are getting more important. The second schematics will be explained below. In the first accumulation schematic, Phase B consists of a Spring and a test.
The Spring
The Spring clearly defines the beginning of Phase C. The Spring is a quick and strong price move below the previously defined support levels with a fast rejection back inside the trading range of the accumulation cycle.
It acts like a bearish trap for retail investors. With the breakout of the trading range below important support levels, a big number of buyers are selling their shares or closing their long positions. At the same time, many short sellers are joining the market. Both events are to the benefit of the big institutions. They are absorbing positions on the buy side by scared buyers as well as on the sell side by the short sellers. Keep in mind that long positions that are getting closed are acting like sell orders in the market. With that combination, the bigger institutions can pair even more buy orders with the big number of shorts and position closures. Often the Spring contains a big wick that takes out the important support lines of the accumulation. Price still likes to close inside the trading range after that event. A valid Spring does not need to show big volumes, because the institutions already sought open supply.
The Shakeout
A Shakeout can be viewed as a much deeper Spring. While the Spring is taking out the Support and quickly returns into the trading range, a Shakeout can have a much deeper impact. The Shakeout is a big spike to the downside, which can have a bigger volume in the down move. Retail traders will see a Shakeout as a clear bearish signal, while the institutions can absorb the remaining Supply. A Shakeout will often occur when the institutions are not ready for the markup jet. They need to seek more supply for their orders to get filled. That rapid move will do the job.
Test
The next event of Phase C is the Test of the Spring and more important the previously defined support. The Spring or Shakeout will get tested after the institutions absorbed the remaining supply. There can be multiple Tests before the markup starts. Still, if the institutions were not able to absorb enough supply, another Shakeout or Spring can occur. Then we should reconsider our markup and the accumulation cycle with all phases. The Tests of a Wyckoff Accumulation always are testing the supply to give the market makers insights if the market is ready for the markup.
Phase C of the Accumulation is very important for our markup. The Test of major Springs or Shakeouts can give bigger RRs for a Wyckoff trader. Keep in mind that the accumulation is not validated yet. Long positions should be seen as partial entries for longer-term long positions. Trading the end of Phase C is quite risky compared to trading later phases with a more validated Wyckoff Accumulation but can give bigger Risk-To-Reward-Ratios.
Accumulation Phase D
Phase D of a Wyckoff Accumulation is showing the first strength after the institutions absorbed the supply. As soon as Phase C ends, demand should dominate supply. On the chart, we can spot that higher demand with the Sign of Strength and multiple Last Points of Support. In this phase, the price should reach at least the top of the trading range defined by the accumulation. Phase D provides the validation of the whole Accumulation cycle if analysed correctly. That’s the phase where we can enter long positions with high accuracy.
Sign of Strength (SOS)
The Sign of Strength is showing the first clear sign of the upcoming markup. With the Sign of Strength, price is validating our previous market analysis. The SoS will reach for the resistance, which was defined in Phase A and Phase B. The strong bullish move is usually accompanied by increased spreads and higher volume. The Sign of Strength should just validate our analysis of the previous phases. Otherwise, it is easy to confuse different schematics and start to see events that are not important for our market cycles or even bring us to the wrong side of the market.
Last Point of Support (LPS)
The Last Point of Support follows the SoS and often occurs after the Spring and Test. There definitely can be multiple LPS. The LPS is a pullback to a previous resistance level which is now a support. That’s why our definition of the trading range and all the events of the phases are really important.
Back Up (BU)
While the LPS can occur also before the SoS, the Back Up will show up after the Sign of Strength. The Back Up is just another title for the LPS after the SoS.
Phase D offers high-probability trading opportunities when the accumulation cycle was analysed correctly. The SoS validates our accumulation analysis and the BU and LPS give us great entries with mostly small drawdowns and high rewards.
Accumulation Phase E
The last phase of the Accumulation schematic is Phase E. In This phase, the price leaves the range of the accumulation and the markup begins. Now demand is in control of price and even the public starts to jump on the bullish market. The market is now in a clear uptrend with strong bullish moves and smaller retracements. Now retail sees the typical trend patterns of higher highs and higher lows. Shakeouts can still occur, but with much less impact than inside the actual accumulation.
As price comes into Phase E a Wyckoff trader should already have his long positions filled and should start taking partial profits at higher time frame levels within this phase. The only time we want to continue opening long trades from a Wyckoff standpoint is a Re-Accumulation after Phase E. The markup of Phase E completes the accumulation cycle with all of Phase A-E. Eventually, the longer-term targets are already hit or we are just holding partials of the positions for those targets. Phase E is the time to pay the trader.
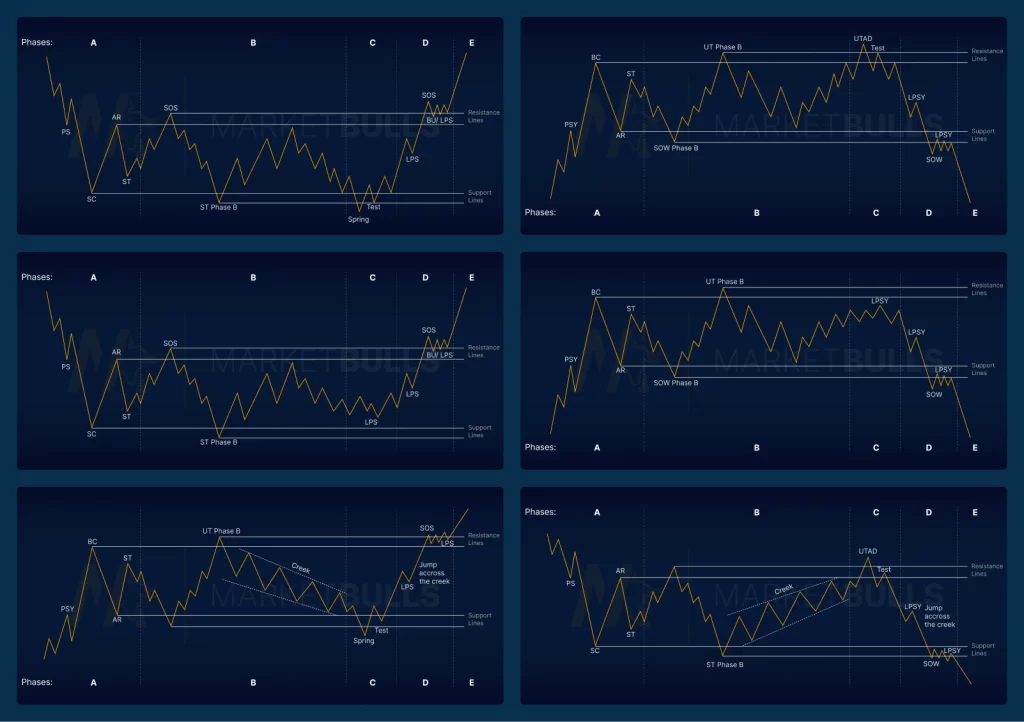
Accumulation Schematics 2
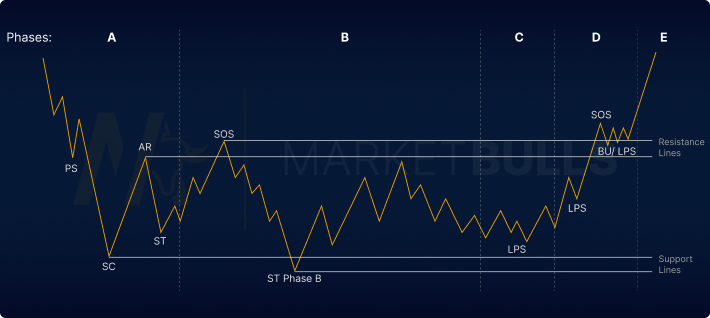
The Wyckoff accumulation schematic 2 is separated according to the same phases. The main difference is that there is no Spring in Phase C. Instead of trapping the buyers, the market has already too much bullish momentum to create a Spring. This accumulation schematic is harder to validate and should be traded only with a clear fundamental understanding and/ or validation due to the latest cot report or seasonal tendencies.
Wyckoff Reaccumulation
A Re-Accumulation occurs during a long-term up trend, which will continue in the future. The main street is finally on the right side as well. Inside a wyckoff reaccumulation schematic, buyers are closing parts of their long positions and sellers are joining the market. With the incoming selling positions, market makers can fill new long positions again.

The events and phases are still the same. Only the beginning of the re-accumulation cycle is different and equals the start of a distribution cycle. Take a look at the Wyckoff distribution for the occurring events.
The main events that differ from an accumulation or distribution cycle are the occurrence of the creek. The creek is a small trend over time and can equal a smaller consolidation. The creek builds liquidity on both sides of the market and misleads market participants.
Jump Across the Creek (JAC)
The Jump Across the Creek is the event that causes the SoS. The JAC does take out previous resistance lines with a strong up move. The Jump Across the Creek can also occur inside the trading range of the accumulation. The Creek can be the horizontal resistance defined by Phases A and B or an internal trendline that formed inside Phase B.
After the spring and test events, there is a bullish price move with momentum. This is called the Jump Across the Creek. Price continues with a bullish Phase E.
Wyckoff Distribution Schematic & Pattern
The Wyckoff Distribution cycle equals the accumulation cycle in the foundation but only comes in place on overbought markets. The distribution appears after an uptrend and ends in a reversal of price. Inside a distribution pattern, the market makers are exchanging their last long orders and starting to build their short positions for a long downtrend. The Law and Cause effect stays in place. The longer the distribution cycle lasts the bigger the effect on the price to the downside. Inside the distribution cycle, the market makers will manipulate prices until they stack enough short positions.
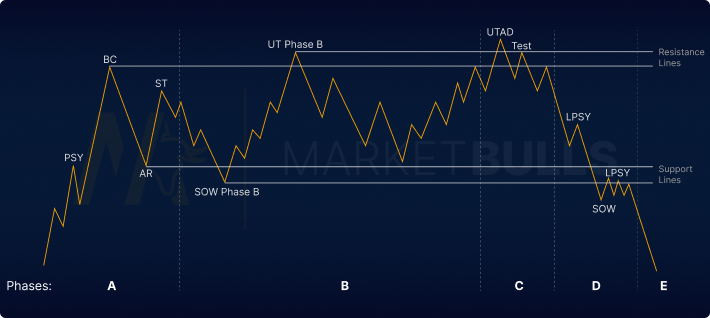
Distribution Phase A
Phase A of a Wyckoff distribution schematic 1 is ending the uptrend and pauses the momentum. Demand has exceeded Supply for a longer period, which changes now. The spread is widening and the volume increases.
Phase A of a distribution contains the Preliminary Supply (PSY), Buying Climax (BC), Automatic Reaction (AR), and Secondary Test.
Preliminary Supply (PSY)
The Preliminary Supply gives the first resistance after the uptrend. This first sign of resistance is caused by the market makers starting to close long positions. With that, the volume can rise, while the spreads are widening.
Buying Climax (BC)
With the Buying Climax, the public buying power reaches its peak. This strong buying power is filled by the institutional short positions. The Buying Climax is often seen when a bigger news event occurs.
Automatic Reaction (AR)
The Automatic Reaction defines the lower end of the trading range for the upcoming distribution cycle. This event shows a stronger supply in the market, which is directly caused by the Buying Climax.
Second Test (ST)
With the Secondary Test of the Buying Climax, the volume decreases as the price is testing the already-formed resistance. The Test of the Trading range shows that supply is now greater than demand. Still, the Secondary Test can take out the previous swing high, but should quickly return inside the trading range.
Distribution Phase B
Phase B of the distribution is building the cause for the future downtrend. The market makers are trying to exhaust the remaining demand and build their short positions inside the longest phase of the distribution.
Sign of Weakness (SOW)
The Sign of Weakness is defining the trading range for the distribution cycle on the lower end. While volume and spreads are increasing during this event indicates a future dominant supply. A clear support level is built by the SOW.
Upthrust in Phase B (UT Phase B)
As the SOW is defining the lower end of the trading range, the UT defines the upper end. The UT Phase B can take out the Buying Climax to bring in buyers and scare sellers of their positions. Typically the market makers can absorb these positions to close their long positions and build more and more short positions over time.
Distribution Phase C
Within Phase B the most obvious event of the distribution schematic occurs. The UTAD is taking all the liquidity of the previously defined resistance. Buyers get trapped and sellers lose confidence. That is the time for the institutions to build up most parts of their positions for the upcoming downtrend.
Upthrust After Distribution (UTAD)
As the price takes out the latest swing highs, the UTAD can be viewed as a typical bull trap. But in the context of all distribution phases, it will be much more accurate. Price takes most of the liquidity on the upside and fastly rejects back into the trading range.
UTAD Test
This event is testing the Spring and the previously defined resistance lines. The Test gives a clear confirmation about the upcoming downtrend and changing supply and demand.
Distribution Phase D
Phase D now validates the distribution cycle with clearer price moves to the downside. This phase still contains multiple smaller bullish moves, which are ending in LPSYs. These LPSY’s can be used to take short positions in the middle of the trading range or after a clearer Sign of Weakness.
Last Point of Supply (LPSY)
The LPSY gives entry possibilities for longer-term short positions. As the LPSY is a swing point after a smaller rally you can higher your Risk-Reward ratio by entering higher prices.
Sign of Weakness Phase D (SOW)
The SOW in Phase D validates the Distribution. Price movement gets clearer and the break of our main support lines ends in high probability short setups.
Distribution Phase E
Within Phase E the downtrend unfolds and the price leaves the trading range of the distribution cycle. Phase E contains multiple trading opportunities on retracement entries. For these entries, we recommend using smaller time frame entry techniques. Price should now follow the Wyckoff market cycles. The markdown will end in a Re-Distribution, Accumulation, or consolidation.
Distribution Schematic 2
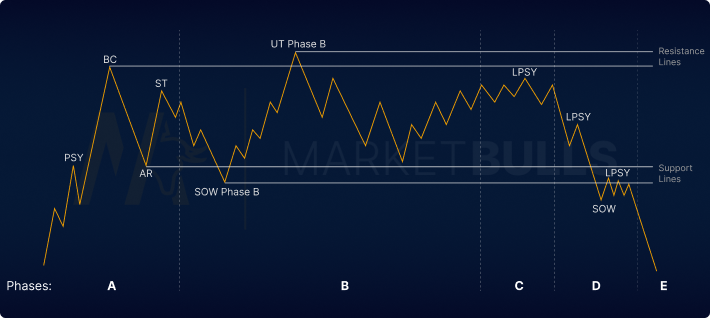
Distribution Schematic 2 contains the same phases and most of the events. The only difference is that there is no need for the institutions to generate a UTAD because demand is already weak and their short positions are filled. The UT stays the highest swing point and instead of a UTAD, there is an LPSY which most of the time takes liquidity of a swing-high inside the trading range.
Wyckoff Redistribution

The Re-Distribution occurs inside a markdown cycle and stops a down-trend for a longer period. After bigger price moves even the Main Street joined the trend. Now it is time for the market makers to bring the price into a consolidation phase to scare sellers and bring in new buyers. That ensures new liquidity for the institution’s to place new short orders. The start of a Wyckoff redistribution schematic is the same as an Accumulation cycle. A Creek inside the trading range creates liquidity on both sides of the market, which gets taken by a UTAD. Many people will see this as a break-out to join bullish price action, but don’t get fooled. With a Jump across the Creek, the price is not only returning into the trading range but going to continue the downtrend from before.
Avoid Mistakes Trading Wyckoff
Many believe that simply labeling the events is sufficient for detecting Wyckoff cycles. But do not forget that a supposed Accumulation can also become a Re-Distribution. Therefore, it is essential to presuppose a fundamental market analysis and confirm a Wyckoff cycle with cot data, seasonalities, or other longer-term confirmations.
Also, do not make the mistake of looking for Accumulations and Distributions in lower time frames. It is easy to draw a supposed accumulation on a 5-minute chart, but a real Accumulation takes place in much higher time frames.
Since a Wyckoff cycle takes time to unfold, you have to wait for the events to occur and be fully validated. Otherwise, you will quickly get distracted by the noise within the actual moves and make bad trading decisions in the worst case.
Wyckoff Accumulation & Distribution in Forex & Crypto Trading
Since the method is a charting technique, it can be applied to any market. This means that Wyckoff trading can be highly profitable in the forex markets with the right expertise. In crypto trading, Wyckoff can be used for chart analysis, but in these newer markets, it is important to note that it is unclear to what extent the markets are controlled and manipulated by the market makers. This will become clearer in the future with more accurate backtesting.
Wyckoff Accumulation & Distribution Cycles can be found in every major forex pair and can be traded with high accuracy. Still, a fundamental understanding of the forex market is essential for long-term profitable trading decisions. Wyckoff market cycles can also be identified and traded in the crypto markets. It is important to note that an accumulation or distribution of cryptocurrencies should be validated with other trading strategies.
Wyckoff Trading In Real Markets
Many people intend that trading the Wyckoff method is easy and that you just have to mark up the events and phases. But keep in mind that most of these publications and markups are done after the price already left the Accumulation or Distribution phase. Without underlying analysis, an Accumulation can fastly turn into a Re-Distribution cycle.
Therefore, it is essential to keep track of the overall market conditions and combine the Wyckoff method with other trading strategies to higher your accuracy and gain more in the long term. MarketBulls is providing you tools to analyse seasonal tendencies and cot data to really underline Wyckoff cycles. Keep in mind that you should only trade strategies you back-tested yourself, before trading them on a live account.


