Risk & Trade Planning
Position Size CalculatorLot Size Calculator
Stop Loss Take Profit Calc
Risk to Reward Calculator
Breakeven & Win Rate
Risk of Ruin Calculator
Margin Call Calculator
Forex Calculators
Pip Value CalculatorMargin Calculator
Forward Rate Calculator
Carry Trade Calculator
Leverage Calculator
Volatility Calculator
Spread Calculator
Forex Rebate Calculator
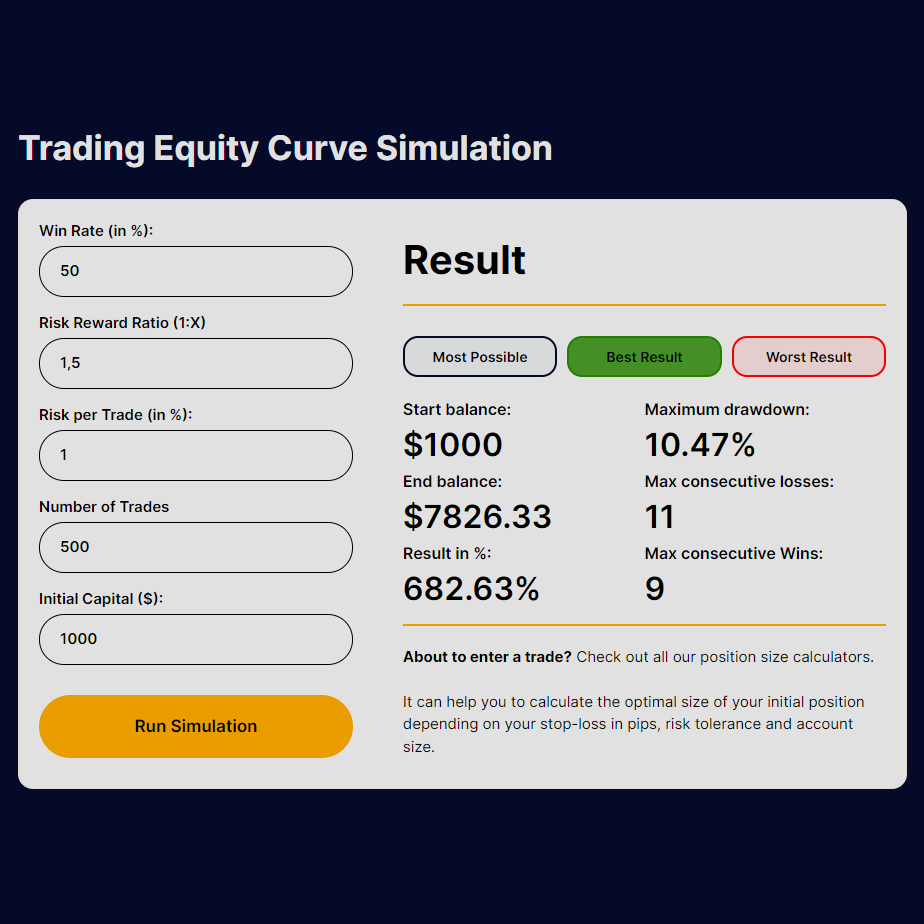
Trading Equity Curve Simulation
Result
Start balance:
$0
End balance:
$0
Result in %:
0.00%
Maximum drawdown:
0.00%
Max consecutive losses:
0
Max consecutive Wins:
0
About to enter a trade? Check out all our trading calculators.
Stay ahead of the game by analyzing your trades with precision, ensuring accurate and long-term profitable trading decisions.
Trading Equity Graph Result
Equity Curve Simulation
Visualizing Success in Forex Trading
Welcome to our premier Trading Equity Curve Simulator – the tool every serious trader needs in their arsenal. Whether you’re just stepping into the world of Forex or are a seasoned equity market player, understanding and analyzing your trading performance is crucial. Our simulator provides an unparalleled visual representation of your trading strategies over time, empowering you to make data-driven decisions.

What Is an Equity Curve?
An equity curve is a graphical representation of the changing value of a trading account over a period. It reflects the growth or decline in capital based on a series of trades, depicting the volatility and stability of your trading strategy.
Why Use a Trading Equity Curve Simulator?
Our simulator isn’t just another tool; it’s a leap towards consistent and improved trading outcomes. With the ability to forecast your potential growth, you’re equipped to fine-tune your strategies before applying them in real-time markets.
How to Use the Trading Equity Curve Simulator
- Enter your start balance: The initial capital you plan to trade with.
- Define your win rate (%): The percentage of trades you expect to win.
- Set the risk-reward ratio: The expected return compared to the risk taken on each trade.
- Specify the risk per trade (%): The portion of your capital risked on a single trade.
- Choose the number of trades: The total trades to simulate.
- Click “Run Simulation”: See your strategy’s potential over time.
Overview of Results
The Trading Equity Curve Simulator outputs three possible scenarios—Most Possible, Best, and Worst Results—each providing valuable insights:
- Most Possible Result: Reflects a realistic outcome based on your entered win rate and risk-reward ratio, offering a balanced view of expected performance.
- Best Result: Illustrates the highest potential of your trading strategy, serving as a benchmark for optimal market conditions.
- Worst Result: Indicates the strategy’s resilience during unfavorable market conditions, essential for risk assessment.
Result Key Metrics
- Start and End Balance: Shows initial investment and its growth or decline.
- Maximum Drawdown (Max DD): The largest potential loss, key for evaluating risk.
- Max Consecutive Losses/Wins: Provides insights on the strategy’s stability and potential streaks.
- Result in %: Percentage change in capital, summarizing overall strategy effectiveness.
Equity Graph Insights
The graph presents a visual trajectory of your account balance over a series of trades, color-coded for clarity:
- Progression of Trades: Follow the line along the x-axis to see the evolution of trades.
- Balance Fluctuations: The y-axis reveals the rise and fall of the account value, emphasizing the impact of each trade.
FAQ
A trading equity curve simulator is a tool that forecasts the value of a trading account over time based on hypothetical trades, helping traders visualize potential strategy performance.
Use our simulator by inputting your trading parameters, such as start balance, win rate, and risk-reward ratio, to generate a visual equity curve.
Yes, our simulator allows you to adjust the risk-reward ratio to reflect various trading scenarios.
Higher risk per trade can lead to greater fluctuations in the equity curve, indicating a more aggressive strategy.
Simulating consecutive losses and wins helps in understanding the resilience and potential recovery of your trading strategy during a losing streak or capitalizing on a winning trend.


