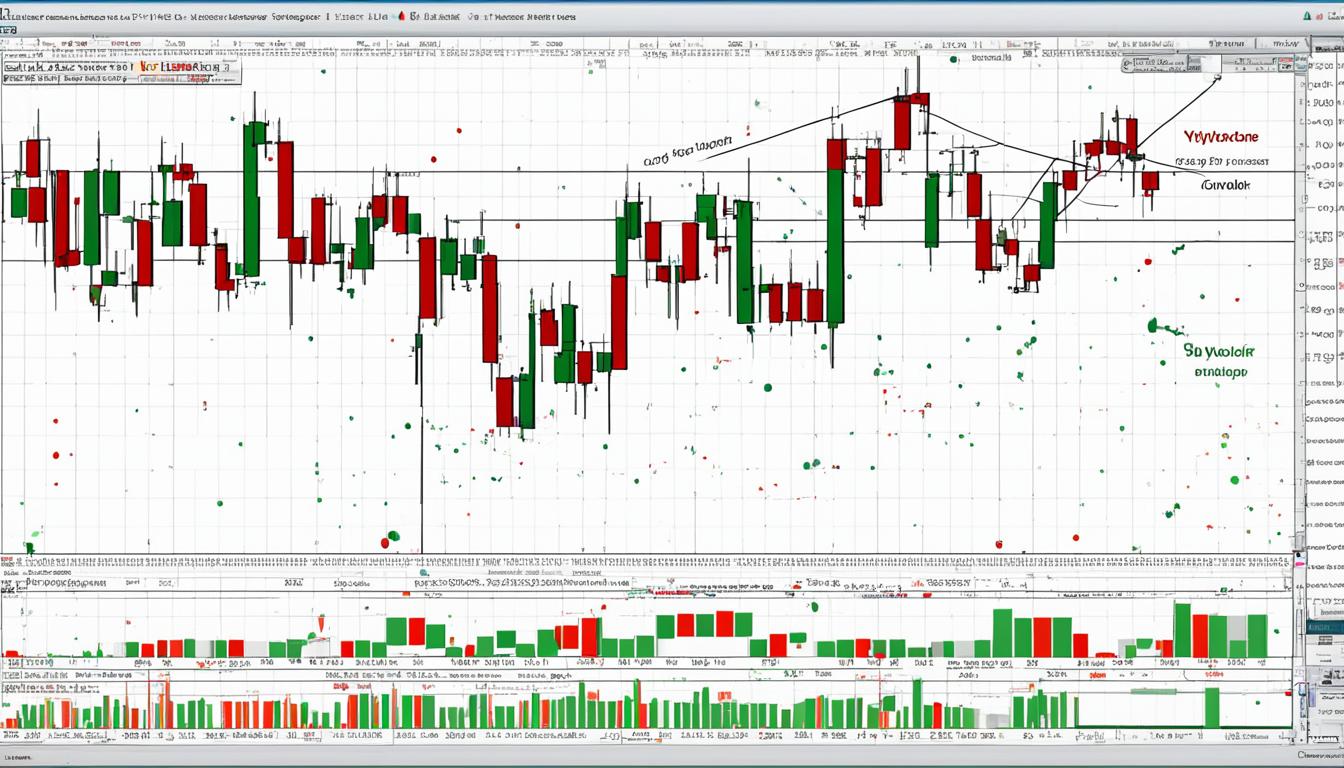
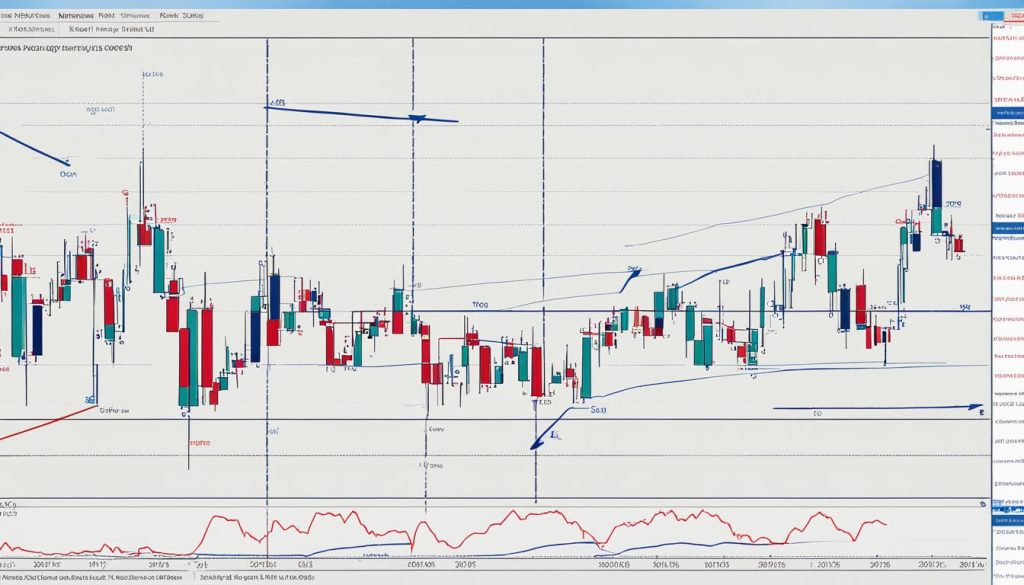
Wyckoff Volume Spread Analysis (VSA) is a key tool in technical analysis. It combines price movements with trading volume to spot market trends. It’s famous for reading what big investors, like banks, plan to do. When used well, it helps traders move in the same way as the market. This leads to smarter decisions in both market behavior analysis and stock price analysis. Traders who use Wyckoff VSA can improve their stock trading skills.
Key Takeaways
- Wyckoff Volume Spread Analysis (VSA) focuses on the link between price and volume for technical analysis.
- It’s good at showing market trends by looking at the moves of big investors.
- VSA helps traders go with the market’s flow for better market behavior analysis.
- With Wyckoff VSA, traders can make better choices in stock price analysis.
- Knowledge from VSA can boost how traders buy and sell stocks.
Understanding Wyckoff Volume Spread Analysis
Wyckoff Volume Spread Analysis (VSA) is a key tool. It looks at how price moves relate to trading volume. Developed by Richard D. Wyckoff, this approach gives a detailed view of market actions. This makes it a favorite for smart traders wanting to grasp stock price changes.
What is Wyckoff Analysis?
Wyckoff analysis focuses on price and volume working together. It shows how the market really works. Big investors drive the market, and by following them, traders position themselves for success.
The Fundamental Principles of Wyckoff Analysis
Wyckoff’s theories are built on three main laws:
- Law of Supply and Demand: It says prices go up when demand is more than supply, and drop when there’s too much supply.
- Law of Cause and Effect: This points out that there’s always a reason (cause) behind market actions that lead to certain results (effect). Knowing these causes can help predict what will happen in the future.
- Law of Effort vs. Result: This law looks at volume (effort) compared to price moves (result). Different patterns here can show unusual or potential turning points in the market.
Why Volume Spread Analysis Matters
Volume analysis, especially in Wyckoff’s method, is a powerful way to understand market intentions. By looking at the size of price changes and their trading volume, traders learn about true market actions. This method shows whether volume backs up price movements, hinting at where the market might go next.
Furthermore, analyzing buyers and sellers’ decisions is key in Wyckoff’s analysis. Knowing these details helps traders match their moves with market trends effectively.
| Principle | Description |
|---|---|
| Supply and Demand | Prices rise when demand exceeds supply, and fall when supply exceeds demand. |
| Cause and Effect | Market events cause proportionate market outcomes, useful for forecasting. |
| Effort vs. Result | Analyzes the relationship between trading volume and price movements to identify market trends. |
Key Components of Wyckoff Volume Spread Analysis
Understanding the Wyckoff Volume Spread Analysis (VSA) is key for traders. It lets them look at price changes closely. It combines supply and demand, market stages, and volume trends. Knowing these elements helps traders guess where the market might go accurately.
The Role of Supply and Demand Dynamics
Supply and demand determine how prices move. In Wyckoff VSA, looking at these levels tells a lot about future prices. If more people want a product than is available, prices go up. If there’s more for sale than people want, prices drop. This shows if the market is strong or weak.
Identifying Market Phases with Wyckoff Analysis
Wyckoff VSA also helps spot different market stages. These include when prices are building up, going down, or staying the same. Knowing where the market is in this cycle tells a lot. It reveals if prices might go up or down soon.
For example, when smart investors are buying, prices could soon rise. When they’re selling, prices often fall. This cycle can repeat, giving traders a chance to see upcoming trends.
Volume Patterns and Their Significance
Watching how trading volume changes can explain a lot. Smart investors can leave clues in the trading patterns they make. For instance, big trading spikes or sudden drops in activity often signal coming changes in the market. Reading these signs early helps traders make better choices.
Trying to predict when big investors will move can be risky. But, by using indicators like volume changes, traders can have a better picture of what might happen.
Together, understanding supply and demand, market stages, and volume changes is the core of Wyckoff VSA. Using this knowledge can boost traders’ skills. It can help them follow the pros in making investment choices.
How to Implement Wyckoff Volume Spread Analysis in Trading
Wyckoff Volume Spread Analysis (VSA) is a method that helps traders look at market moves closely. By using a strong trading strategy and watching stock trends carefully, traders can make better choices.
Step-by-Step Guide to Analyzing Stock Trends
Learning Wyckoff VSA means grasping stock trends well. Take these steps to move through the market smartly:
- First, figure out the market phase. Is it in accumulation, distribution, re-accumulation, or redistribution?
- Look at volume bars next. The width of price bars and how much is traded can show important market moves.
- Then, watch for price changes. See how volume affects prices to guess the next move.
Using Technical Tools for Enhanced Accuracy
Add technical tools to improve your VSA’s accuracy.
- Trend lines: They show support and resistance visually.
- Moving averages: Smooth out price data to see trend directions better.
- Volume oscillators: They track money going in and out of stocks.
Common Pitfalls and How to Avoid Them
But traders should watch out for common problems and know how to avoid them:
| Pitfall | Strategy to Avoid |
|---|---|
| Over-relying on one tool | Mix different tools for a full view of the market. |
| Not looking at the big picture | Always consider what the overall market is doing when you look at trends. |
| Letting your beliefs sway your analysis | Keep away from personal biases when you read data. |
To use Wyckoff VSA well, stick to these steps. They help you adjust your trading strategy for better and more reliable results in trading stocks.
The Psychology Behind Wyckoff Volume Spread Analysis
Knowing how trading psychology and market actions work together is key in trading success. Wyckoff Volume Spread Analysis (VSA) looks at the technical and mental sides of market shifts. By understanding these mental elements, traders can handle market complexities better.
Trader Psychology and Market Movements
Trader emotions greatly affect market moves. Feelings like fear and greed influence choices, which can lead to crowd behavior. Knowing how these feelings change our trading helps us react to market changes better. So, Wyckoff VSA includes understanding emotions and market data for a complete look at the markets.
Understanding the Behavior of Institutional Investors
Institutional investors, with their big resources, can hugely impact market trends. They have a lot of information to make choices that can change the market. Studying what they do can give traders hints on where the market might go. Knowing their motives and moves gives a competitive edge in trading.
Putting together trading psychology and institutional investors’ actions with Wyckoff VSA helps in-depth market analysis. This approach gives traders the right tools to make smart decisions, following the market’s true movement.
Conclusion
In today’s fast-changing world of finance, learning about Wyckoff Volume Spread Analysis (VSA) is a must for traders. It helps them deeply understand the connections between prices and trading volumes. Traders can then make smart moves based on clear data instead of guesses.
Wyckoff VSA teaches traders about market stages and how supply and demand affect prices. It also highlights the role of big investors’ actions. Knowing these things helps traders make better predictions and decisions.
Learning Wyckoff VSA means becoming skilled at studying and foreseeing market trends. This skill boosts traders’ confidence and positions them to grab new chances. As a strategy, Wyckoff VSA is key for traders who want to improve how they analyze markets and make trades.
FAQ
What is Wyckoff Analysis?
Wyckoff Analysis helps predict stock prices. Richard D. Wyckoff created it. This method looks at the link between price, volume, and time. It’s a way to understand and forecast market trends. It examines supply and demand and uses laws like cause and effect and effort versus result.
The Fundamental Principles of Wyckoff Analysis?
Wyckoff’s core ideas are crucial. They discuss supply and demand, cause and effect, and effort versus result. There’s a balance in the market affected by these principles. Significant changes in prices have reasons behind them. And, how much the price changes, along with the trading volume, shows the strength of trends.
Why Volume Spread Analysis Matters?
Volume Spread Analysis is key for understanding market movements. It looks at the price spread and volume. This tells if big investors are buying or selling. Traders use this to predict where the market is going.
The Role of Supply and Demand Dynamics?
Supply and demand are at the core of analyzing markets. They set prices. Traders watch these dynamics to guess where prices might go. This helps them decide when to buy or sell.
Identifying Market Phases with Wyckoff Analysis?
Wyckoff Analysis points out stages like buying, selling, and market pauses. Knowing these stages is key. It helps traders understand market cycles. This guides their trading strategies.
Volume Patterns and Their Significance?
Volume patterns show what big money is doing. High volume usually means buying or selling by big investors. Low volume might mean smaller investors are not as active. Recognizing these patterns can help predict stock movements.
Step-by-Step Guide to Analyzing Stock Trends?
Start by figuring out the current market phase. Look at how volume bars and price spreads relate. Also, study past price movements. Using tools like trend lines adds depth to your analysis.
Using Technical Tools for Enhanced Accuracy?
Tools like trend lines and moving averages can help. They give more data to understand trends better. With these tools, traders can make smarter decisions, increasing their success chances.
Common Pitfalls and How to Avoid Them?
Mistakes include not reading volume patterns right and too much trust in one signal. Avoid these by looking at all the clues. Using multiple tools gives a clearer trading picture.
Trader Psychology and Market Movements?
Feelings like fear and greed influence the market strongly. Knowing this can make traders smarter. It helps them stick to solid strategies and not make hasty choices.
Understanding the Behavior of Institutional Investors?
“Smart money” shapes the market. Following these investors’ actions can be profitable. Understanding their moves through Wyckoff VSA can guide a trader’s strategy to win.


