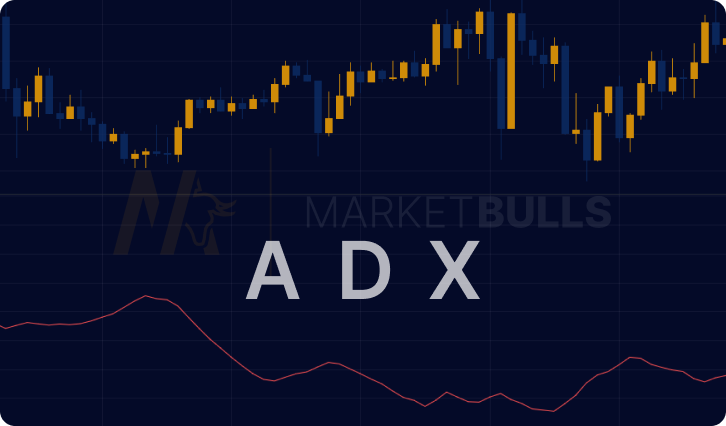
Financial markets can often seem like a maze. One of the ways traders attempt to navigate this complexity is by employing the ADX Indicator Strategy. Conceived by Welles Wilder, this invaluable tool assists traders in determining the strength of a trend, equipping them with the necessary information for their investment decisions.
Understanding the ADX Indicator Strategy
The Average Directional Index (ADX) forms a part of the trader's toolkit used to gauge the strength of an ongoing trend. It is a part of the Directional Movement System developed by Welles Wilder. The ADX is typically used alongside the Positive Directional Indicator (+DI) and Negative Directional Indicator (-DI) to develop a well-rounded trading strategy.
Computing the ADX: The Formula
The ADX is computed through a series of steps. Initially, the +DI and -DI values are calculated using the directional movement (DM) and true range (TR) values of the asset. These values are then smoothed over a given period, typically 14 periods, to attain the Average Directional Movement Index. The final ADX value is derived by averaging this index over a chosen period, usually 14 periods.
Despite seeming complex, most trading platforms come with built-in ADX indicators, relieving traders of performing these calculations manually.
Trading Using the ADX Indicator Strategy
Utilizing the ADX Indicator Strategy involves interpreting the ADX, +DI, and -DI values. Here's a step-by-step guide:
- Identify a trending market: An ADX value above 25 generally indicates a strong trend, while a value below 20 suggests a weak trend or sideways market.
- Determine the trend direction: If the +DI is above -DI, the trend is up (bullish), and vice versa.
- Enter or exit trades: Traders generally enter long positions when the +DI crosses above -DI in a strong upward trend (ADX > 25) and short positions when -DI crosses above +DI in a strong downward trend.

ADX Indicator Strategy in Forex Trading
The Forex market, with its high liquidity and 24-hour trading cycle, often presents significant price movements. This makes the ADX Indicator Strategy especially useful in Forex trading, as it can identify strong trends in currency pairs. The strategy remains consistent, but the heightened volatility of the Forex market should be taken into consideration when setting stop losses or take profit levels.
Application of the ADX Indicator Strategy in Cryptocurrency Trading
The ever-evolving field of cryptocurrency trading has also found the ADX Indicator Strategy to be of use. The crypto markets, characterized by their high volatility and rapid price shifts, can benefit from the trend strength analysis provided by the ADX.
Incorporating ADX and Seasonal Data
Seasonal data refers to market changes that follow a predictable pattern within each year. By integrating seasonal data with the ADX Indicator Strategy, traders can develop a more comprehensive trading strategy. While the ADX identifies the strength of the trend, seasonal data can hint at the potential timing of trend reversals.
The ADX Indicator Strategy and the Exponential Moving Average
The Exponential Moving Average (EMA) is another trading tool that assigns greater weight to recent data, making it more responsive to price changes. When used in conjunction with the ADX Indicator Strategy, it can provide valuable insight into the direction of the trend. A rising EMA in a strong trend (ADX > 25) could suggest an ideal time to enter a long position, while a falling EMA could indicate an opportunity to short.
Best Practices for the ADX Indicator Strategy
Here are some tips to make the most out of the ADX Indicator Strategy:
- Combine ADX with other indicators: While ADX measures trend strength, it doesn't indicate trend direction. Pairing it with other indicators like moving averages or Bollinger bands can offer more rounded trading signals.
- Use ADX for setting stop losses: ADX can assist traders in risk management by indicating when a trend might be losing strength.
- Patience is key: Wait for clear signals from the ADX before initiating a trade. Markets with high volatility can give rise to false signals.
Conclusion
The ADX Indicator Strategy is a robust tool for measuring trend strength in financial markets. With a comprehensive understanding of its applications and calculations, traders can effectively utilize it to make informed trading decisions. Like all trading strategies, its efficacy is maximized when combined with other tools and practices.
FAQ
The standard setting for ADX is 14 periods, which suits most trading styles, including day trading. However, this can be adjusted to suit a specific strategy or timeframe.
The ADX Indicator Strategy is employed in Forex trading similarly to other markets. It’s used to ascertain the strength and direction of trends.
Absolutely, the ADX Indicator Strategy can be used in any market, including stocks, forex, and commodities.
While the ADX is a useful tool for determining trend strength, no indicator is foolproof. It should be used in conjunction with other trading tools and strategies.
The ADX indicator can be added to the MT4 platform by clicking on ‘Insert’ > ‘Indicators’ > ‘Trend’ > ‘Average Directional Movement Index’.
Yes, the ADX Indicator Strategy can be suitable for beginners, as it helps identify strong trends, which can be one of the simpler aspects of the market for new traders to grasp. However, it requires practice and experience to use effectively.


