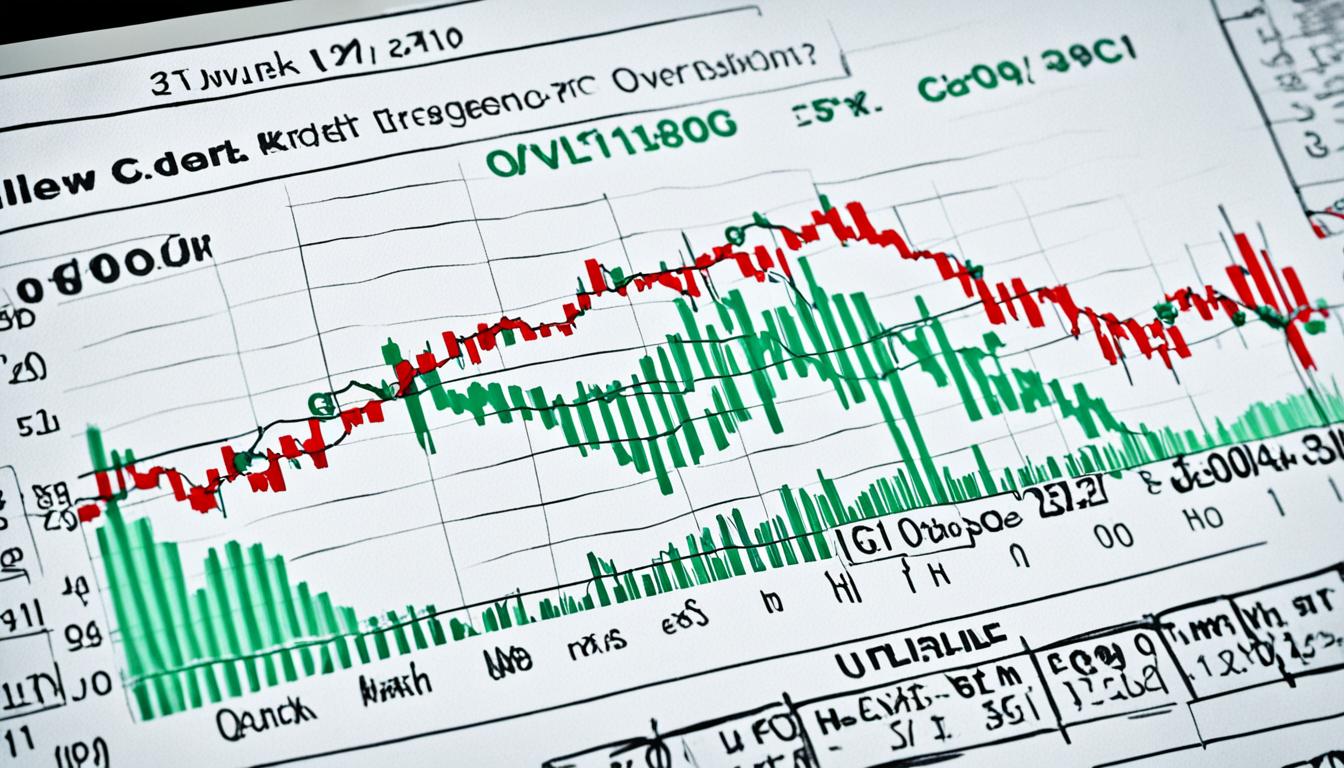
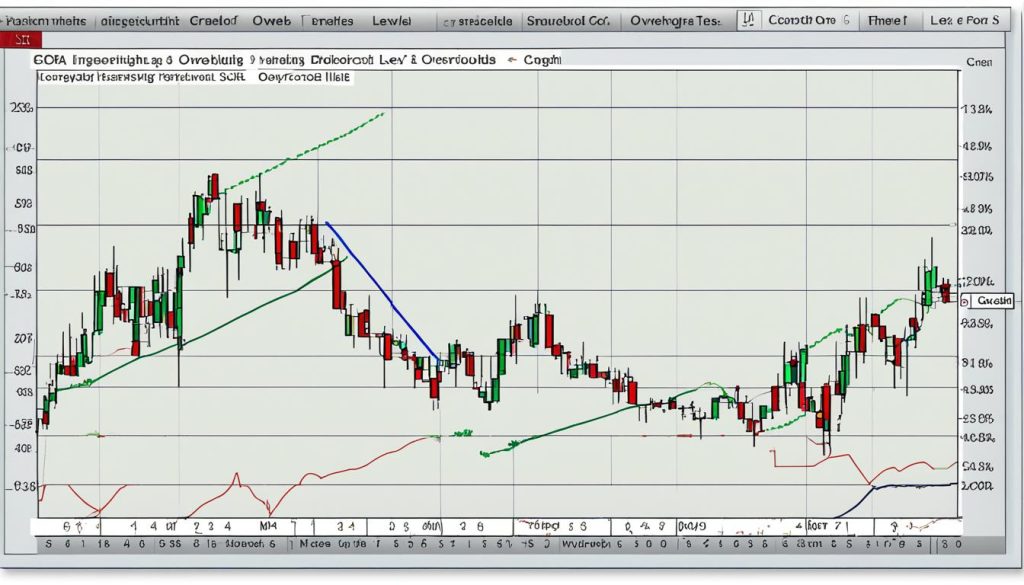
In the world of technical analysis, the overbought oversold indicator is key for traders and investors. It helps spot when a security is too high or too low in value. This is vital for making smart trading signals. Learning how to use these indicators can greatly improve your ability to forecast price movements and make better trading choices. This article looks at the top tools for spotting these conditions and how they affect trading results.
Key Takeaways
- Overbought and oversold indicators are crucial in technical analysis for spotting security valuations.
- These indicators create precise trading signals, leading to smarter investment choices.
- Using these tools well can better predict stock market price trends.
- Learning about different indicators gives a deep understanding of market conditions.
- The article will review key indicators and offer insights on their use in real trading situations.
Understanding Overbought and Oversold Conditions
In trading, knowing about market conditions is key. Traders look at overbought and oversold conditions to predict price changes.
Definition of Overbought Conditions
An overbought condition means an asset’s price is too high. This happens when many traders buy it, pushing the price up quickly. Such a situation often leads to a price drop.
Definition of Oversold Conditions
On the flip side, an oversold condition means an asset’s price is too low. It’s seen when there’s too much selling. Expect a price bounce back as selling slows down.
The Role of Market Momentum
Momentum indicators are key in spotting overbought and oversold conditions. They track price changes to show trend strength or weakness. Market sentiment and events affect these conditions. Using these indicators helps traders predict trend changes and make better decisions.
| Condition | Cause | Possible Outcome |
|---|---|---|
| Overbought Condition | Excessive buying | Price correction or downturn |
| Oversold Condition | Excessive selling | Price stabilizing or upturn |
Key Indicators for Identifying Market Conditions
Investors use technical indicators to understand market conditions. These tools show the strength, speed, and possible changes in price trends. We’ll look at four key indicators traders and analysts rely on.
Relative Strength Index (RSI)
The Relative Strength Index (RSI) measures how fast and how much prices change. It moves between zero and 100 over a 14-day period. If the RSI is above 70, an asset is likely overbought. A reading below 30 means it’s oversold. This indicator helps spot when prices might change direction.
Stochastic Oscillator
George Lane created the Stochastic Oscillator. It compares the latest closing price to past prices over a set time. The oscillator goes from zero to 100. High readings mean an asset is overbought, while low readings suggest it’s oversold. It’s great for finding good times to buy or sell based on price trends.
Moving Average Convergence Divergence (MACD)
The Moving Average Convergence Divergence (MACD) tracks trends using momentum. It’s the difference between two moving averages. A line plots this difference, with a signal line below it. When the MACD line goes above the signal line, it could be a buy signal. Going below might mean it’s time to sell. This indicator shows the strength and direction of price trends.
Commodity Channel Index (CCI)
Donald Lambert introduced the Commodity Channel Index (CCI). It shows how the current price compares to past prices over a period. High readings mean an asset is overbought, while low readings suggest it’s oversold. The CCI is useful for spotting trends in an asset’s price movement.
Choosing the Best Overbought Oversold Indicator
Picking the right overbought oversold indicator depends on your trading style, the market you’re in, and how often you want trading signals. It’s important to understand these factors well to make good choices.
Factors to Consider
When looking for an overbought oversold indicator, think about the signals it gives and how they fit your trading plan. Important things to consider include market volatility, the type of investment, and the time frame for analysis. For example, the relative strength index (RSI) is versatile but might need tweaking for your specific strategy.
Comparative Analysis
Comparing different technical analysis tools helps in finding the best overbought oversold indicator. Here’s a table showing the good and bad of some popular indicators.
| Indicator | Strengths | Limitations |
|---|---|---|
| Relative Strength Index (RSI) | Easy to use and good at spotting overbought and oversold levels. | May give false signals in markets that are very volatile. |
| Stochastic Oscillator | Tracks price momentum and historical range for better accuracy. | Can give many signals, which might confuse new traders. |
| MACD (Moving Average Convergence Divergence) | Great for spotting trend reversals. | Is a lagging indicator, not best for quick market changes. |
| Commodity Channel Index (CCI) | Flexible and works in various market conditions. | Is complex and might need adjustments for better results. |
Customization and Adjustments
Customizing and adjusting technical analysis tools is key to making them work better. Setting the right parameters and adjusting time frames can make signals more reliable. For instance, adjusting the RSI settings for a specific stock can improve trading signals. Using indicators like the RSI and MACD together can also give stronger and more reliable insights, which can help improve your trading.
Case Studies in the Stock Market
Real-world examples show how overbought and oversold indicators work in the stock market. These tools help investors understand market conditions and make smart trading choices.
In 2020, the stock market crashed, and the Relative Strength Index (RSI) was key. Investors used it to spot oversold signals during the chaos. This led to profits when prices went back up.
Another example is the Stochastic Oscillator in 2018. It warned of a pullback in tech stocks like Amazon. Traders sold high and bought low, making a profit.
The Moving Average Convergence Divergence (MACD) indicator was also useful. It helped traders know when to lock in profits or start new trades. It showed how technical analysis tools adapt to market changes.
In 2019, the Commodity Channel Index (CCI) showed energy stocks were oversold. Investors who followed this indicator made big gains when energy stocks rallied.
These examples highlight the importance of overbought and oversold indicators. They help traders make better decisions in different market conditions. With these tools, trading becomes more precise and confident.
Advanced Techniques for Technical Analysis
In trading, learning advanced technical analysis is key. By combining indicators, traders can check signals and make better trades.
Combining Multiple Indicators
Using several indicators can improve your analysis. For example, the Relative Strength Index (RSI) and the Moving Average Convergence Divergence (MACD) together show momentum and trend direction. This method helps traders adjust to different market situations.
Interpreting Trading Signals
Good trading depends on understanding trading signals. Tools like the On-Balance Volume and Stochastic Oscillator give key insights. They show when to buy or sell, matching the market.
Adapting to Different Market Conditions
Markets change often, so strategies must too. Advanced technical analysis helps tailor your approach. By adjusting indicators based on market changes, traders stay ahead.
| Indicator | Primary Use | Best for Market Condition |
|---|---|---|
| RSI | Identify Overbought/Oversold Levels | Range-Bound |
| MACD | Trend Following | Trending |
| Stochastic Oscillator | Momentum | Volatile |
| On-Balance Volume | Confirm Price Moves | Trending |
Conclusion
Our journey to find the best overbought oversold indicator has been both detailed and insightful. These tools are crucial for traders who want to improve their technical analysis. They help traders move through the complex stock market with better accuracy.
We looked at important indicators like the Relative Strength Index (RSI), Stochastic Oscillator, and Moving Average Convergence Divergence (MACD). Each indicator has its own strengths. Using them together helps traders make smarter trading signals. This leads to better investment choices.
Customizing these indicators can also make their insights more specific to your trading style and the market you’re in.
The future of technical analysis is exciting, and overbought oversold indicators will play a big part. These tools are getting more advanced, giving traders detailed data to work with in a fast-changing market. Staying ahead by using these innovations is crucial. It helps traders make smart moves and grab market opportunities.
FAQ
What is an overbought oversold indicator?
An overbought oversold indicator is a tool for technical analysis. It shows if a security is too high or too low in price. These indicators help traders and investors make smart choices in the stock market.
How do overbought and oversold conditions differ?
Overbought means an asset’s price is too high because it has been bought too much. Oversold means the price is too low because it has been sold too much.
What role does market momentum play in overbought and oversold conditions?
Market momentum shows how strong price trends are. It can make overbought and oversold conditions stronger. The balance between buyers and sellers affects these conditions a lot.
What are some key indicators for identifying market conditions?
Important indicators include the Relative Strength Index (RSI), Stochastic Oscillator, Moving Average Convergence Divergence (MACD), and Commodity Channel Index (CCI). These tools help analyze price trends. They give valuable insights for trading decisions.
How do I choose the best overbought oversold indicator?
Choosing the best indicator depends on your trading style and the market you’re looking at. You should also think about how often you want trading signals. Comparing indicators like RSI, Stochastic Oscillator, MACD, and CCI can help pick the right one for you.
Can overbought oversold indicators be customized?
Yes, you can customize overbought oversold indicators. By adjusting parameters and time frames, you can make signals more reliable and accurate. This way, you can tailor technical analysis to your needs.
How have overbought oversold indicators been successfully used in the stock market?
Real-world examples show how overbought oversold indicators work well in stock trading. These cases show how technical analysis and trading signals lead to good investment results.
What are some advanced techniques for technical analysis using overbought oversold indicators?
Advanced techniques include using several indicators together to check signals. This makes signals more accurate. Also, understanding trading signals in context and adjusting indicators for different markets makes technical analysis more precise and effective.


