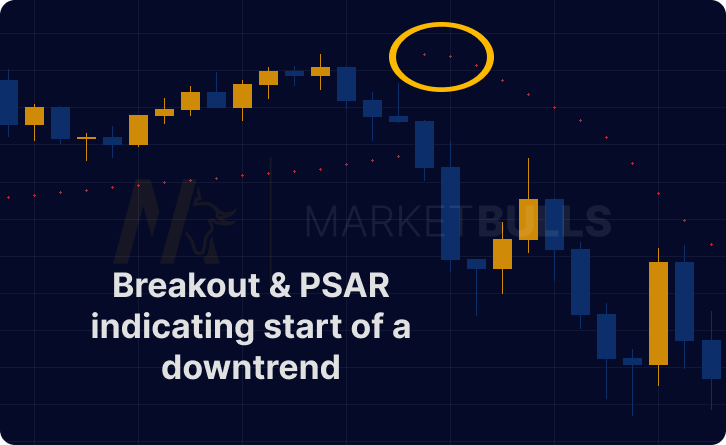
Welcome aboard the journey to unlock the power of the Parabolic SAR (Stop and Reverse) Indicator. With this extensive guide, we’ll uncover the core components of this compelling indicator and the detailed strategies to enhance your trading game. Use the indicator to confirm your seasonal trading entries.
Decoding the Parabolic SAR Indicator
The Parabolic SAR, or PSAR, is a renowned tool in the trading world for its effectiveness in tracking an asset's momentum. Pioneered by the acclaimed market analyst Welles Wilder in the late 1970s, it's become an integral part of many a trader's toolkit. The key to its popularity? Its straightforward visual depiction and practical use in trading.
The PSAR appears as dots on a price chart either above or below the price bars, providing crucial buy and sell signals for traders. But, how is it calculated? Let’s dive into the math behind this compelling tool.
The Mathematical Essence of the Parabolic SAR
The PSAR calculation can be intricate but is essential for a comprehensive understanding of its operation. The formula for an uptrend PSAR is:
PSAR = Prior PSAR + Prior AF (Prior EP – Prior PSAR)
For a downtrend, it's the inverse:
PSAR = Prior PSAR – Prior AF (Prior PSAR – Prior EP)
Where:
- PSAR refers to the Parabolic Stop and Reverse.
- AF stands for the Acceleration Factor, initially set at 0.02 and increasing by 0.02 each time a new extreme point (EP) is reached, with a maximum value of 0.20.
- EP or Extreme Point, is the highest high during an uptrend and the lowest low during a downtrend.
Understanding this calculation can give you a more comprehensive grasp of the indicator and enhance your decision-making.
Mastering the Parabolic SAR Strategy
The Parabolic SAR's power unfolds in two primary aspects – identifying market trends and highlighting potential reversal points. But how does this translate into a practical trading strategy?

Trend Identification
In Parabolic SAR's language, dots appearing above price bars signal a downtrend – a cue to potentially sell. On the other hand, dots below price bars denote an uptrend – suggesting a possible buying opportunity. This visual simplicity is what makes the Parabolic SAR an excellent tool for rapid trading decisions.
Spotting Reversals
This is where the Parabolic SAR proves invaluable, highlighting potential trend reversals. A shift in the position of the SAR dots indicates a possible trend change. Utilizing these insights can remarkably enhance your trading performance.
Let's imagine you're monitoring a stock with the PSAR on your chart, and you notice the dots switch from appearing below to above the price bars. This is a potential signal that the trend might be reversing from an uptrend to a downtrend – and could be a cue to sell.
Remember, while the Parabolic SAR is a powerful tool, integrating it with other trading indicators can improve accuracy and steer clear of false signals.
Enhancing Trading Efficiency: The 2 Parabolic SAR Strategy
The 2 Parabolic SAR strategy involves using two Parabolic SARs with different settings. The idea is to filter out noise and deliver more reliable trading signals, fortifying your profit parabolic trading strategy.
Consider using two PSARs: one with a more sensitive setting for early trend detection and a second with less sensitivity to confirm the trend and avoid whipsaws.
Designing a Profitable Parabolic Trading Strategy
To craft your profitable parabolic trading strategy, here's a handy blueprint:
- Team up with Other Indicators: Supplement the Parabolic SAR with indicators like the Relative Strength Index (RSI) or Moving Average Convergence Divergence (MACD).
- Test the Waters: Backtest your strategy against historical data.
- Manage Risk: Always incorporate risk management tools, such as stop-loss orders.
Pitfalls to Avoid
While the Parabolic SAR is undoubtedly a useful tool, it isn’t flawless. For instance, in a sideways market, the PSAR can yield false signals due to its inherent trend-following nature. Be wary of these limitations and adapt your strategy accordingly You can use other indicators like the MACD for confirmation.
Conclusion
The Parabolic SAR is a robust, versatile trading tool, but its effectiveness hinges on an in-depth understanding of its mechanics, strengths, and weaknesses. With the right knowledge, strategy, and caution, it can serve as a potent weapon in your trading arsenal.
FAQs
The Parabolic SAR calculation involves the use of the prior period’s SAR, the prior period’s extreme point (EP), and the acceleration factor (AF).
The Parabolic SAR can be used to identify trends and potential trend reversals. The appearance of dots below the price bar indicates an uptrend and a potential buying opportunity, while dots above suggest a downtrend and a possible selling opportunity.
The 2 Parabolic SAR strategy involves using two PSARs with different settings to filter out market noise and provide more reliable trading signals.
The Parabolic SAR can generate false signals in a sideways market due to its trend-following nature. Therefore, it is recommended to use the PSAR in conjunction with other indicators.
Yes, the Parabolic SAR can be applied across different trading types, including forex, commodities, stocks, and more.
To enhance the Parabolic SAR’s effectiveness, use it alongside other indicators, always backtest your strategies, and incorporate robust risk management practices.


