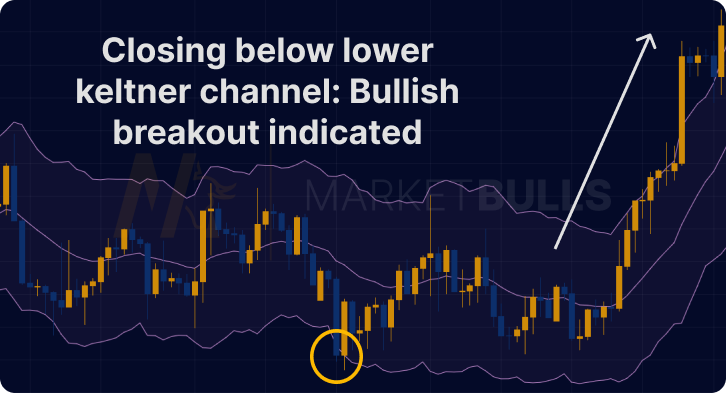
In the trading world, strategy is king, and understanding the indicators that guide these strategies can make or break your success. One such strategy is the Keltner Channel Indicator Strategy, a powerful tool for identifying market trends and volatility.
Origins of the Keltner Channel
Before delving into the specifics, it’s worthwhile to explore the history of the Keltner Channel. Named after its creator, Chester Keltner, the original Keltner Channel was outlined in his 1960 book "How To Make Money in Commodities". Initially, it was based on a 10-day simple moving average (SMA) of the Typical Price, with bands above and below that were derived from the High-Low range. However, modern iterations often use the Average True Range (ATR) to set the channel width.
Keltner Channel: Calculations Unveiled
Understanding the Keltner Channel begins with understanding its composition. It’s a three-line channel that includes an upper line, middle line, and lower line.
- Middle Line: 20-day SMA
- Upper Line: 20-day SMA + (2 x 10-day ATR)
- Lower Line: 20-day SMA – (2 x 10-day ATR)
This calculation can be adjusted based on the market you are trading. Short-term traders might use smaller parameters, while long-term traders might use larger ones.
Incorporating Keltner Channel Indicator Strategy on MT4
The MT4 platform might not have the Keltner Channel as a default feature, but adding it is straightforward. You just need to download the Keltner Channel MT4 indicator, add it to your "Indicators" folder, restart MT4, and you can access it from your custom indicators menu.
Applying Keltner Channel Bands for Trading
The upper and lower bands of the Keltner Channel serve as dynamic support and resistance levels. When the price crosses and closes above the upper band, an upward trend could be starting. Conversely, a downward trend could be underway if the price crosses and closes below the lower band.

Adjusting Keltner Channel for Market Conditions
The Keltner Channel is versatile and can be adjusted based on market conditions. For more volatile markets, traders might increase the multiplier for the ATR to create wider channels. For quieter markets, reducing the ATR multiplier can help keep the channels narrower and more responsive to price changes. Combining the Keltner Channel indicator with COT Data could lead into higher trading accuracy.
Keltner Channel Indicator Strategy in Practice
Now, let’s look at a practical application. If the price breaks above the upper Keltner Channel band with a surge in volume, it might indicate the beginning of an upward trend. Traders can consider this as a buying opportunity. On the other hand, if the price breaks below the lower band with a surge in volume, it might be a good time to sell.
FAQs
The Keltner Channel was created by Chester Keltner and was first outlined in his 1960 book “How To Make Money in Commodities”.
The parameters of the Keltner Channel can be adjusted to better suit different market conditions. For more volatile markets, you might increase the ATR multiplier, and for less volatile markets, you might decrease it.
Absolutely! Using the Keltner Channel with other indicators such as RSI, MACD, or volume can give more reliable trading signals.
Like any strategy, the Keltner Channel Indicator Strategy is not foolproof. It might provide false signals, especially in choppy markets. Hence, it’s crucial to use it alongside other indicators and tools.


