Navigating through the tumultuous tides of the market can often be a daunting task. With the Vortex Indicator (VI), traders can obtain a sharper lens to scrutinize the constant ebb and flow of market trends. In this detailed guide, we dissect the Vortex Indicator to its core, tracing its origins, delving into its mathematical foundations, and illustrating its potent use cases in the world of trading. Especially in combination with other indicators, like the macd, the VI can be a high accuracy trading signal
Unearthing the Vortex Indicator: A Comprehensive Overview
Conceptualized as a technical analysis tool, the Vortex Indicator elucidates the relationship between market highs and lows, offering traders valuable insights into trend changes and price movements. But what sets the VI apart from other indicators? The uniqueness of the VI lies in its unrivaled ability to detect the initiation, progression, and culmination of market trends, offering traders an upper hand in volatile markets.
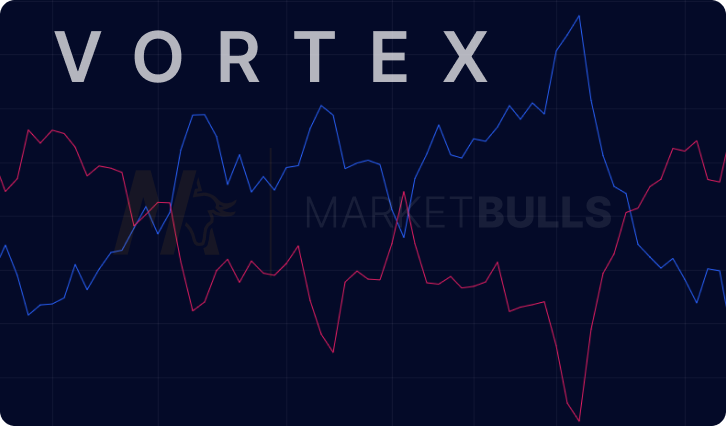
Understanding the basic components of the VI, which include the positive and negative Vortex Indicators (+VI and -VI), is the first step to leveraging its powers. These elements encapsulate upward and downward price movements, respectively, enabling the trader to map the course of the market's trajectory.
Tracing the Vortex Indicator's Origins: The Genesis and Influence
Credit for the conception of the Vortex Indicator goes to Etienne Botes and Douglas Siepman. The year was 2010 when these two visionaries introduced the VI in the January edition of the well-renowned magazine, 'Technical Analysis of Stocks & Commodities'. With a conceptual framework derived from the natural flow of water and the formation of vortices, the VI quickly found its place in the trader's arsenal of technical analysis tools.
Since its advent, the Vortex Indicator has dramatically influenced trading strategies worldwide. Traders across the globe have been able to improve their predictive accuracy and bolster their profits, all thanks to the VI.
Mastering the Vortex Indicator Calculations: An In-depth Exploration
At the nucleus of the Vortex Indicator lie two integral components – the positive Vortex Indicator (+VI) and the negative Vortex Indicator (-VI). To comprehend the VI, one needs to delve into the calculation process involving the highest, lowest, and closing prices of an asset, executed in several meticulous steps.
| Component | Formula |
|---|---|
| Positive movement | Current high – previous low |
| Negative movement | Previous high – current low |
| True Range | Maximum (current high – current low, absolute (current high – previous close), absolute (current low – previous close)) |
| +VI | (Positive movement / True Range) x 100 |
| -VI | (Negative movement / True Range) x 100 |
To elucidate these calculations, let's consider a hypothetical example. Suppose the current high is $20, the previous low is $18, the previous high is $19.5, and the current low is $19. Given this data, the positive movement is $20 – $18 = $2. The negative movement is $19.5 – $19 = $0.5. The True Range would be the maximum between the current high minus the current low ($20 – $19 = $1), the absolute difference between the current high and the previous close (assuming it is $19.5, so $20 – $19.5 = $0.5), and the absolute difference between the current low and the previous close ($19.5 – $19 = $0.5). Hence, the True Range is $1. Consequently, +VI equals ($2 / $1) x 100 = 200, and -VI equals ($0.5 / $1) x 100 = 50.
Applying the Vortex Indicator in Trading: Tactics and Techniques
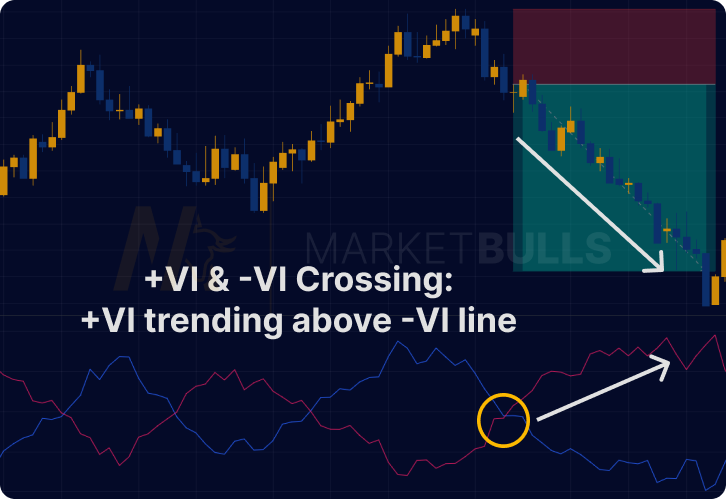
The Vortex Indicator can be a trader's best friend, offering invaluable buy and sell signals based on the crossover of the +VI and -VI lines. When the +VI line ascends above the -VI line, it signals a bullish trend, hinting at a potential buying opportunity. In contrast, when the -VI line exceeds the +VI line, it's indicative of a bearish trend and a potential selling or shorting opportunity.

Let's illustrate this with an example. Consider a scenario where the stock price of Company A has been steadily climbing over the past few days. During this time, you observe that the +VI line has crossed over the -VI line. Based on this, you decide to buy shares in Company A, anticipating that the price will continue to rise.
A Step-by-Step Guide to Trading with the Vortex Indicator
Set up the Vortex Indicator on Your Chart: The Vortex Indicator is typically included in the suite of technical analysis tools on most trading platforms. Simply select it from the list of available indicators. The standard period setting for the Vortex Indicator is 14 periods, which can be adjusted according to your trading strategy and timeframe.
Identify the Crossover Points: Pay attention to the crossover points between the +VI and -VI. A potential bullish trend is signaled when the +VI crosses above the -VI, possibly indicating a good time to buy. On the other hand, a potential bearish trend is suggested when the -VI crosses above the +VI, suggesting a potential selling or shorting opportunity.
Confirm the Signals: Always confirm the signals provided by the Vortex Indicator using other technical analysis tools or indicators such as moving averages, RSI, or institutional cot data. This confirmation step helps to filter out false signals, enhancing the reliability of your trades.
Set Stop Losses and Profit Targets: Once you've decided to enter a trade based on the Vortex Indicator, set your stop losses and profit targets according to your risk tolerance and trading strategy. You might choose to set your stop loss at a recent swing high or low or utilize a trailing stop that moves with the price.
Monitor and Adjust: After entering a trade, continue monitoring the Vortex Indicator. As the +VI and -VI lines continue to move with new data, you'll need to adjust your trades accordingly. If the lines cross over again, it may signal an opportunity to exit your current position or even to enter a trade in the opposite direction.
Remember, while the Vortex Indicator is a powerful tool, it isn't foolproof. Always employ proper risk management strategies and never risk more than you can afford to lose. Trading involves risk and isn't suitable for all investors.
The Pros and Cons of the Vortex Indicator: A Well-rounded Perspective
Like any analytical tool, the Vortex Indicator comes with its strengths and weaknesses. On the positive side, the VI's adeptness at identifying new trends and providing accurate trade signals is a notable advantage. However, the VI may falter during periods of market consolidation, resulting in potential false signals. This is because in a consolidating or sideways moving market, the high and low differences remain small, leading to fluctuations in the +VI and -VI values.
Conclusion
Armed with a robust understanding of the Vortex Indicator and its practical applications, traders can navigate the rough seas of market trading with newfound confidence and precision.
FAQs
The Vortex Indicator is the brainchild of Etienne Botes and Douglas Siepman.
The Vortex Indicator is calculated based on the positive and negative movements and the true range for the period.
The Vortex Indicator signals a potential buying opportunity when the +VI line crosses above the -VI line.
Absolutely, the Vortex Indicator can be effectively used across a variety of markets, given the availability of requisite price fluctuation data.
Yes, the Vortex Indicator can be an excellent tool for short selling. A potential selling or shorting opportunity arises when the -VI line crosses above the +VI line.
One notable limitation of the Vortex Indicator is its propensity to produce false signals during periods of market consolidation or sideways movement.


