Diving into the financial markets can be a tantalizing venture. Yet, it's no stroll in the park. Success demands not just a rudimentary understanding of market dynamics but an effective toolkit of trading strategies. Among them, the Exponential Moving Average (EMA) Strategy reigns supreme. This guide will deconstruct the Exponential Moving Average Strategy, unraveling its potent implications, and showing you how it can bolster your trading prowess.
Unpacking Moving Averages: A Prelude to the EMA
Before you can wrap your head around the Exponential Moving Average (EMA), you must first befriend the concept of a 'moving average.' In trading, a moving average is an analysis technique used to smoothen out data by creating a constantly updated average price. There are two popular types of moving averages – Simple Moving Average (SMA) and Exponential Moving Average (EMA). The SMA assigns equal weight to all periods, while the EMA gives more weight to recent price data, thus being more reactive to price changes. Both indicators are working perfectly inline with COT trading.
Breaking Down the EMA Formula
The EMA formula may seem a bit intimidating at first, but it's an integral part of understanding market trends and momentum. The formula involves two main steps:
SMA Calculation: Calculate an initial Simple Moving Average (SMA) for a specific period as a starting point.
Weighted Multiplier Calculation: Compute a weighted multiplier to apply more weight to recent price data. This multiplier is calculated as [2/(selected time period + 1)].
By giving greater emphasis to recent data, the EMA provides a faster reaction to price changes than the SMA, making it invaluable for active traders.
The EMA Indicator Strategy in Action
The EMA Indicator strategy is a Swiss Army knife for traders, enabling a myriad of applications to analyze market trends and spot potential trading opportunities. Here's how you can deploy the EMA:
| EMA Strategy | Description |
|---|---|
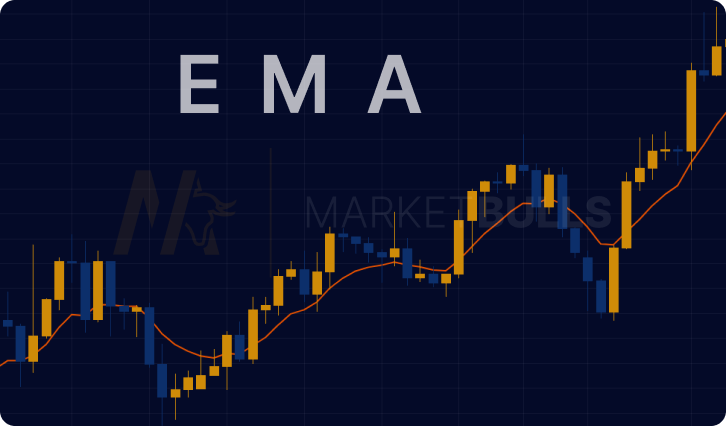
| Single EMA | At the most basic level, the EMA can help identify the direction of market trends. If the price is above the EMA, it denotes an upward trend. Conversely, if the price is below the EMA, it signifies a downward trend. |
| Dual EMA (EMA Crossover Strategy) | With two EMAs of varying lengths, you can identify crossovers – which are potential entry or exit points. When a shorter-period EMA crosses above a longer-period EMA, it signals a potential buying opportunity, referred to as a 'bullish crossover.' The opposite scenario, where a shorter-period EMA crosses below a longer-period EMA, is a 'bearish crossover' and may indicate a selling opportunity. |
| Triple EMA | The 8-13-21 EMA strategy involves three EMAs and can provide a more layered analysis of market momentum. When the EMAs align in ascending order, it hints at a robust bullish trend, while descending order indicates a bearish trend. |
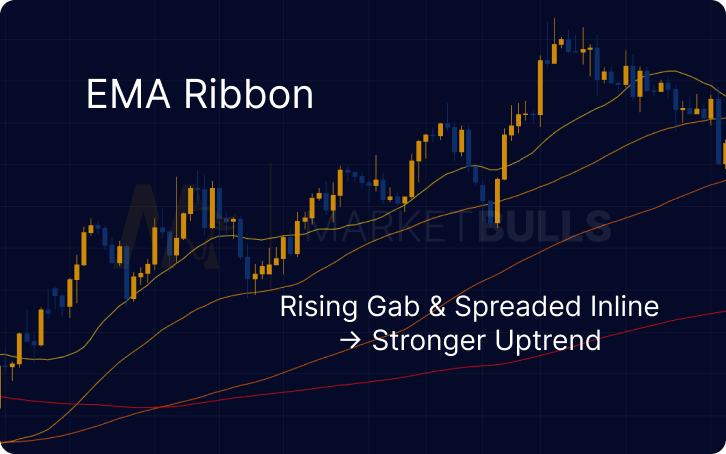
| EMA Ribbons | EMA Ribbons consist of a series of EMAs of consecutive periods plotted on the same chart, creating a 'ribbon' effect. The wider the gap between the individual EMAs, the stronger the prevailing trend. |
| EMA and Bollinger Bands | The EMA can also collaborate with other technical indicators like Bollinger Bands to identify volatile market conditions and potential reversal points. |

EMA's Role Across Trading Styles
The beauty of the EMA strategy is its adaptability. Whether you're into swing trading, day trading, or scalping, EMA can be your trusted ally:
Swing Trading: Swing traders often use dual or triple EMAs to capture the overarching market trend and find potential entry and exit points.
Day Trading: Day traders, who typically execute multiple trades within a single trading day, might use a shorter-period EMA (like a 9-period EMA) to spot short-term trends and a longer-period EMA (like a 50-period EMA) to decipher the overall market direction.
Scalping: Scalpers who aim to profit from minor price changes often use a short-period EMA (like a 5-period EMA) to identify rapid trading opportunities.
EMA in Stock Trading
1. Utilizing EMA in Trend Analysis
In stock trading, the exponential moving average (EMA) is an effective tool for identifying short-term and long-term trends. Using a shorter-period EMA (like a 10-day EMA) can help track immediate price changes, while a longer-period EMA (like a 200-day EMA) provides insight into long-term market sentiment. Monitoring how these EMAs interact with the current stock price can aid in pinpointing bullish or bearish market trends.
2. EMA Crossover Strategy in Stock Trading
The EMA crossover strategy is a popular tactic among stock traders. When the short-term EMA crosses above the long-term EMA, it signals a bullish crossover, indicating a potential buying opportunity. Conversely, when the short-term EMA crosses below the long-term EMA, it hints at a bearish crossover, suggesting it might be a good time to sell.
3. EMA and Volume in Stock Trading
Volume is a critical factor in stock trading. Combining EMA with volume data can yield significant results. When a stock price crosses the EMA accompanied by high trading volume, it strengthens the signal, increasing the likelihood of the price following the trend.
EMA in Forex Trading
The Exponential Moving Average (EMA) strategy holds a crucial place in Forex trading due to its focus on recent prices, making it highly responsive to market changes. Its utility spans trend identification, entry and exit point determination, and risk management.
Trend Identification
The primary use of the EMA in Forex trading is identifying the trend direction. Traders usually employ two EMA lines of different periods. For instance, a commonly used setup involves a 12-period EMA and a 26-period EMA. When the 12-EMA (short-term) is above the 26-EMA (long-term), the market is considered bullish, suggesting an upward trend. Conversely, when the 12-EMA dips below the 26-EMA, it indicates a bearish market or downward trend.
Entry and Exit Points
EMA can also signal optimal entry and exit points. In an upward trend, when the price dips towards the short-term EMA and then starts to rebound, it can be seen as a good entry point to buy. Conversely, when the price begins to fall after touching the short-term EMA in a downward trend, it may signal an optimal point to sell.
Forex traders also look for EMA crossovers as signals. In a bullish crossover, the short-term EMA crosses above the long-term EMA, suggesting an entry point. On the other hand, in a bearish crossover (the short-term EMA crosses below the long-term EMA), it might be an appropriate time to exit or even short-sell.
Risk Management
EMA can also contribute to risk management. Traders often use the long-term EMA as a stop-loss point. If the price breaks significantly below this EMA in an uptrend (or above in a downtrend), it could indicate a trend reversal, providing a signal to exit the trade and limit potential losses.
EMA in Different Forex Markets
EMA strategy is valuable in various forex market conditions. In a ranging market, a flat EMA indicates that the market is moving sideways, thus traders might avoid entering new trades. In a volatile market, a steeply sloping EMA suggests strong momentum, allowing traders to capitalize on large price swings.
EMA in Crypto Trading
Just as in stock and forex markets, EMA is a widely used indicator in crypto trading. Given the highly volatile nature of cryptocurrencies, EMAs help smooth out price fluctuations and offer a clearer picture of the trend direction. Cryptocurrency traders often use a dual EMA or triple EMA strategy to signal potential buying or selling opportunities. Furthermore, the combination of EMA with other technical indicators such as the Relative Strength Index (RSI) or the Moving Average Convergence Divergence (MACD) can provide more robust trading signals in the crypto market.
EMA Strategy: Taking It Up a Notch
Traders who've mastered the basics often elevate their game with advanced EMA strategies. These strategies include:
EMA Crossovers with MACD: The Moving Average Convergence Divergence (MACD Indicator), which is computed using EMAs, can be paired with EMA crossovers to validate potential trading signals.
EMA with Fibonacci Retracement: Fibonacci retracement levels can be combined with EMA crossovers to identify potential support and resistance levels.
EMA with RSI: The Relative Strength Index (RSI) can work alongside the EMA to spot overbought or oversold conditions.
Conclusion
The Exponential Moving Average Strategy isn't merely a technical analysis tool – it's an indispensable compass that steers traders through the often stormy financial markets. Yet, remember that successful trading demands more than mastering one strategy. It requires a deep understanding of market dynamics, a disciplined approach to risk management, and a multifaceted application of various technical indicators.
FAQs
The EMA is a type of moving average that assigns more weight to recent price data, thus being more responsive to price changes.
The EMA is calculated using a two-step process: first, by calculating an initial Simple Moving Average (SMA) for a certain period, and then by applying a weighted multiplier that places more emphasis on recent price data.
The EMA can be deployed as a single EMA to identify trend direction, a dual EMA to spot market crossovers, a triple EMA for nuanced market momentum insights, EMA Ribbons for trend strength, and in conjunction with other indicators for advanced trading strategies.
The EMA offers a quicker reaction to price changes than the SMA, signals potential trading opportunities, provides nuanced insights into market momentum, identifies trend strength, and is adaptable to various trading styles and market conditions.
Absolutely! The EMA is particularly effective in cryptocurrency trading, given the volatile nature of crypto markets. By assigning more weight to recent price data, the EMA allows traders to respond promptly to sudden price changes.
Advanced EMA strategies include EMA crossovers with MACD to validate trading signals, EMA with Fibonacci retracement to identify potential support and resistance levels, and EMA with RSI to spot overbought or oversold conditions.


