For traders immersed in the ever-volatile forex market, mastering the art of identifying and leveraging price reversals is critical to resilience and profitability. Among the most esteemed models for predicting such pivots is the bearish Gartley pattern—a harmonic pattern derived from Fibonacci ratios that expert traders have relied upon since its introduction in 1935. The bearish Gartley pattern not only signals an impending downturn but also fosters a trade environment where risks are mitigated and returns are maximized. Let’s explore the intricacies of this revered pattern and how you can harness its predictive power in forex trading.
Understanding the Historical Origins of the Bearish Gartley Pattern
Delving into the roots of the bearish Gartley pattern reveals a rich history that traces back to the prolific work of H.M. Gartley. His influence on technical analysis and pattern recognition has been instrumental in shaping modern trading strategies. Gartley’s classic book, Profits in the Stock Market, introduced the concept of harmonic patterns to traders worldwide, offering valuable methodologies for navigating the complex terrain of the stock and forex markets.
Origins and Recognition by H.M. Gartley
In 1935, H.M. Gartley laid the groundwork for harmonic trading with his publication. The key principles set forth in Profits in the Stock Market have not only stood the test of time but have also evolved to become core components of technical analysis in forex trading. As traders honed their skills in chart pattern identification, the bearish Gartley pattern emerged as a prominent configuration, lauded for its consistency and reliability.
Application in Forex and Benefits for Traders
The application of the bearish Gartley pattern in forex trading transcends its historical inception. Traders leverage this pattern to discern probable trend reversals and secure positions with favorable risk-reward ratios. The pattern’s meticulous structure helps in forecasting sell opportunities, making it a powerful tool in the arsenal of both novice and seasoned traders alike. The convergence of history, methodology, and practical application has allowed the bearish Gartley pattern to endure as a pivotal component of trading strategy.
Breaking Down the Bearish Gartley Pattern
The Bearish Gartley pattern is a sophisticated harmonic pattern that relies on the precision of Fibonacci ratios to signal potential price reversals. As a subset of harmonic patterns, the bearish Gartley pattern breakdown provides a roadmap for investors and traders looking to capitalize on the rhythmic price movements that echo the ebb and flow of the market.
Fibonacci Ratios and their Importance in the Harmonic Pattern
Fibonacci ratios are crucial components that give the Gartley pattern its predictive power. These ratios, drawn from the Fibonacci sequence, are used to measure the proportions between the swings in price that constitute the pattern. Notably, the key Fibonacci ratios used include 61.8%, 38.2%, and 78.6%, which are believed to be natural retracement levels for price movements in the financial markets. Traders often watch these ratios closely, as they can herald key turning points in price trends.
Identifying Points X, A, B, C, and D in the Pattern
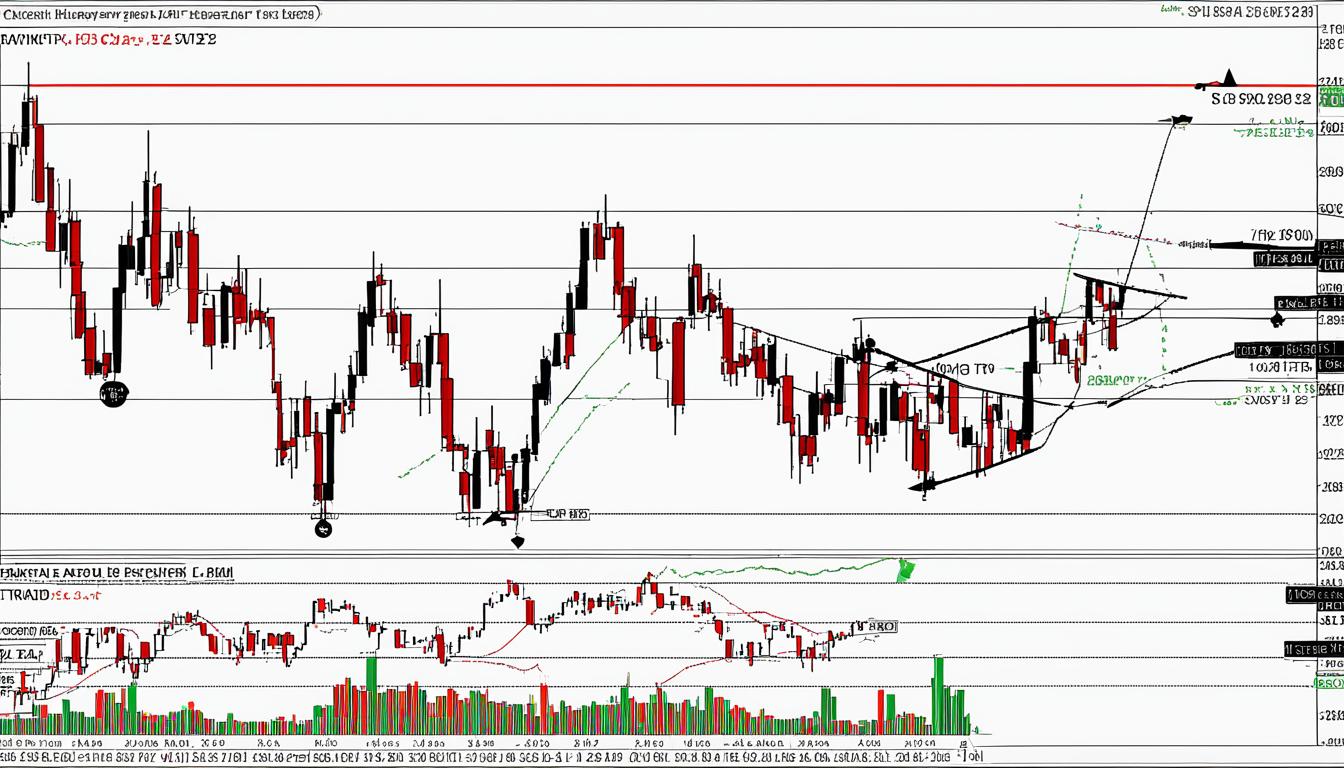
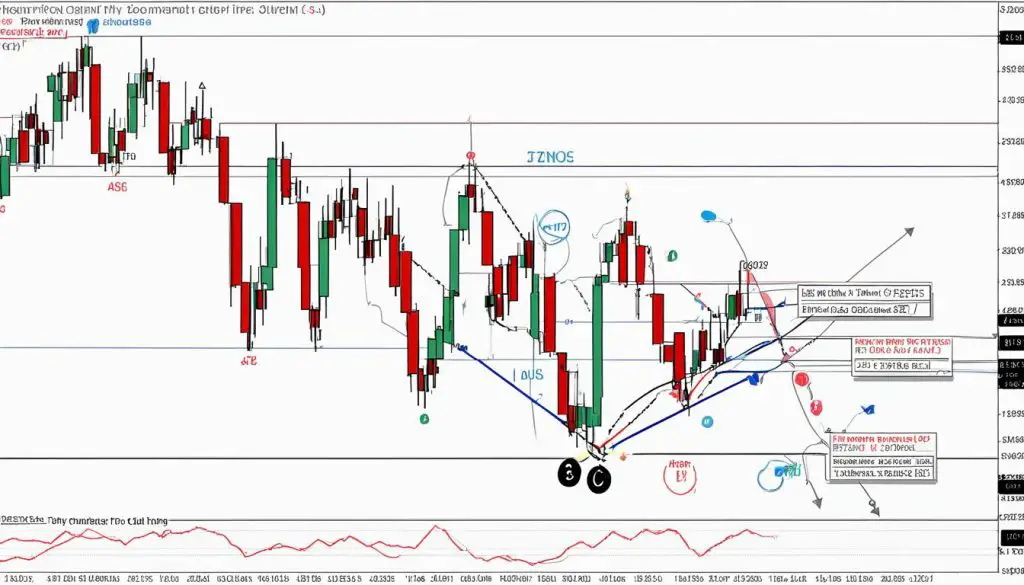
Identifying the distinct points of X, A, B, C, and D is paramount in leveraging the bearish Gartley pattern. These points are not mere placeholders; they represent significant price highs and lows on the price chart. Each point is aligned with specific Fibonacci levels, ultimately painting the pattern’s infamous “M” structure. The alignment of these points with the Fibonacci ratios adds depth to the bearish gartley pattern breakdown and enables the harmonic trader to forecast potential price movements with a greater degree of confidence.
| Swing Point | Corresponding Move | Fibonacci Retracement Levels |
|---|---|---|
| X to A | Initial price swing | 100% |
| A to B | Retracement of X to A | 61.8% or 78.6% |
| B to C | Retracement of A to B | 38.2% or 88.6% |
| C to D | Final leg anticipating the reversal | 127.2% or 161.8% of A to B |
By examining the intricate relationship between these Fibonacci retracement levels and the consequent price moves, one can surmise not only the presence of a bearish Gartley pattern but also the potential exhaustion point for bullish momentum, thereby uncovering potential sell signals at Point D. Understanding the complex interplay of these elements is a core skill for any trader who employs harmonic patterns as part of their technical analysis toolkit.
How to Accurately Draw the Bearish Gartley on a Chart
The precision involved in drawing the bearish Gartley pattern is pivotal for forex traders aiming to harness the power of forex chart analysis. One of the most critical skills for executing this strategy is the identification of price swings, which are integral to the crafting of the Bearish Gartley. Each price pivot (X, A, B, C, and D) is defined by unique Fibonacci retracement levels, and recognizing these points empowers traders to forge an anticipatory stance for market downturns.
Below is a step-by-step guide to making sure each swing and intersection are marked correctly:
| Swing | Fibonacci Level | Identifiable Features |
|---|---|---|
| X to A | No specific level | Initial price drop initiating the pattern |
| A to B | 61.8% – XA retracement | A significant peak not surpassing the initial X level |
| B to C | 38.2% or 88.6% – AB retracement | Price action does not reach level A; the retracement level confirms potential reversal |
| C to D | 78.6% – XA retracement | The completion point of the Bearish Gartley, option for sell orders |
To ensure that your chart remains accurate and easy to interpret, additional visual cues such as identifying trendlines and labeling key Fibonacci levels on each swing can be immensely beneficial.
In summary, mastering the art of drawing the bearish gartley pattern requires meticulous attention to forex chart analysis and price swing identification. By thoroughly understanding and applying these concepts, traders increase their ability to make informed decisions based on advanced technical analysis patterns.
Recognizing the Bearish Gartley Pattern and Its Trading Implications
The intricacies of Forex trading demand a sound understanding of patterns that can signal significant market changes. One such pattern, the Bearish Gartley, is notable for its distinctive ‘M’ shape, which serves as a harbinger for potential market reversals. Insightful recognition of this configuration can play a pivotal role in a trader’s arsenal, providing a strategic edge in the competitive forex market landscape.
The ‘M’ Shape and Market Reversals
Central to the Bearish Gartley pattern is its ‘M’ shape, which traders keenly observe for indications of impending price shifts. This shape is not merely a geometric curiosity but a reflection of underlying market psychology and balance between supply and demand. The completion of this pattern, particularly at point D, often heralds a shift from bullish to bearish momentum, signaling savvy traders to prepare for a strategic move. As a result, the ‘M’ formation has become a cornerstone in Forex trading strategies, aiding in the anticipation of moves that can significantly affect a trader’s position.
Favorable Exit Points and Risk-Reward Optimization
Diligent application of the Bearish Gartley allows for the identification of favorable exit points which are essential in the pursuit of optimal risk-reward profiles. Armed with the knowledge of where the pattern completes, experienced traders can manage their trades to either take profit or minimize losses. The precision that accompanies the utilization of this pattern ensures that decisions are not left to chance. By prioritizing exit strategies grounded in the teachings of the Bearish Gartley pattern, traders can navigate Forex markets with greater confidence, optimizing outcomes while mitigating financial exposure.
FAQ
The Bearish Gartley Pattern is a harmonic chart pattern, utilized in forex trading to identify potential sell opportunities. It is composed of precise Fibonacci ratios that forecast price reversals and provides an effective method for risk-reward optimization.
H.M. Gartley first introduced the Bearish Gartley Pattern in 1935 in his book “Profits in the Stock Market”. It has since been acknowledged for its ability to highlight high-probability selling points in the forex market.
On a chart, the Bearish Gartley Pattern resembles an ‘M’ shape. It is identified by tracing the price swings from X to A, A to B, B to C, and C to D, which correspond with specific Fibonacci levels. The completion of the ‘M’ shape signals a higher probability of a market reversal and a sell opportunity at point D.
Traders can benefit from the Bearish Gartley Pattern by utilizing it to find optimal exit points from long positions, with favorable risk-reward ratios. By anticipating a price reversal at point D, traders can execute sell orders to capitalize on the potential downturn in the market.
When drawing the Bearish Gartley Pattern on a forex chart, it’s important to accurately identify the price swings and corresponding Fibonacci levels to ensure the pattern is valid. Incorrect identification can lead to false signals and poor trade execution.


