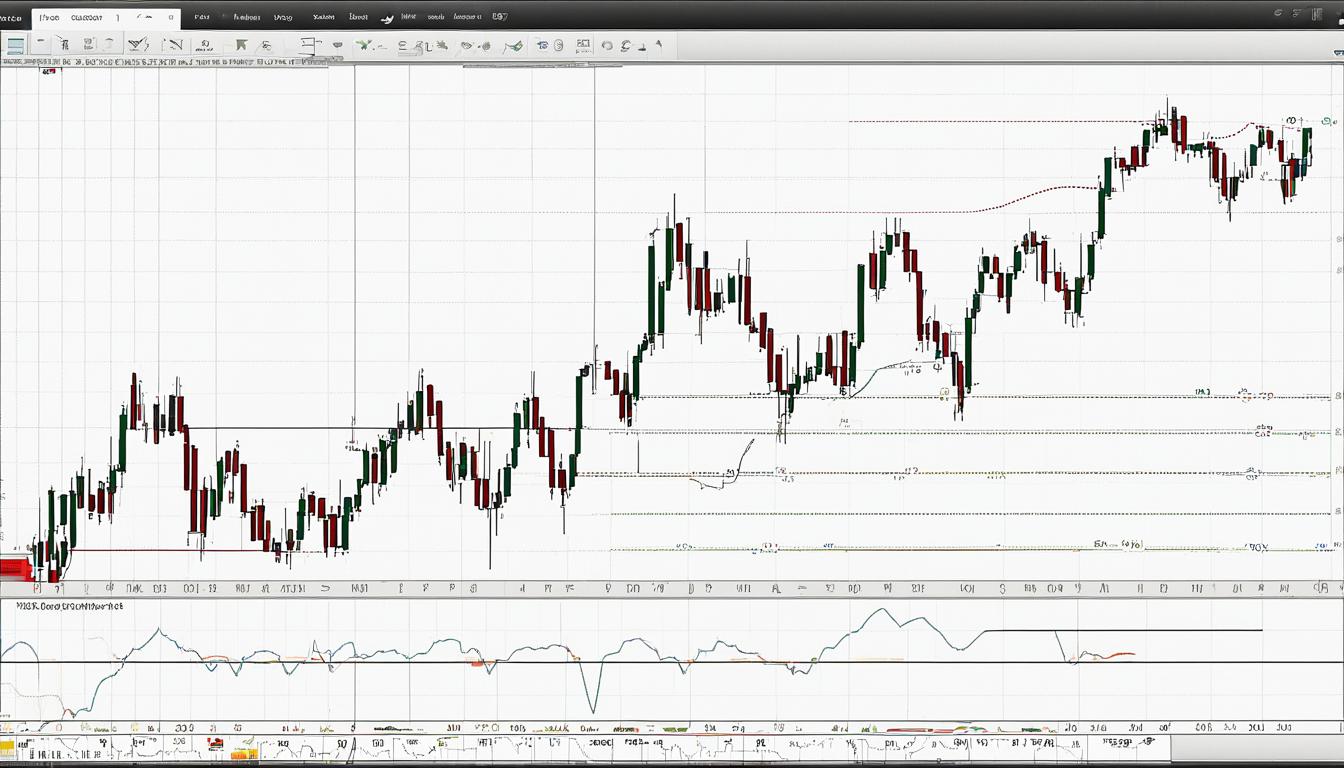
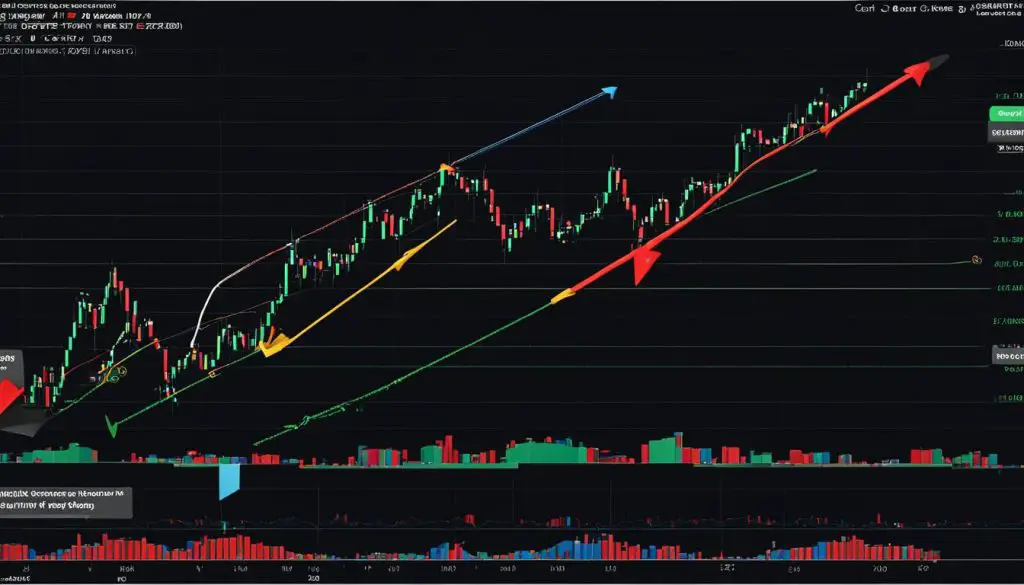
In the realm of stock trading, discerning the right moment to enter a position is pivotal. Among the various technical indicators employed by traders, the cup and handle pattern on weekly chart stands out as an eminent signal for potential longterm bullish trends. With a carefully configured chart setup, this pattern not only suggests but also visually represents an upcoming rise in a security’s market value, as if it’s announcing the dawn of an favorable trading phase.
The architectural integrity of this setup consists of a distinct ‘U’ shaped curve, the cup, succeeded by a modest downward drift—a handle—that beckons with the promise of a continuing upward trajectory. The careful examination of its rounded lows and handle inclination often foreshadows the profitable opportunities lying just over the horizon. Grounded in principles established by William J. O’Neil, this classic pattern is more than a blueprint; it’s a rallying cry for those tuned to the nuances of market mechanics.
Understanding the Cup and Handle Formation
An integral concept in technical trading is the cup and handle formation, a recognized price pattern that signals buying opportunities in security charts. This technical analysis tool depicts a price consolidation period, which is followed by a potential bullish continuation pattern. Developed by William J. O’Neil, this pattern is extensively detailed in his influential book, How to Make Money in Stocks, where he provides a blueprint for detecting pivotal market movements.
Definition and Basic Structure
The cup and handle pattern, often referred to as the C&H, involves a “U” shaped cup followed by a slight downward trajectory known as the handle. A distinguishing feature of this pattern is typically the lower trading volume observed during the handle’s formation, which can be scrutinized on a security chart. This visual clue may alert analysts and investors to a forthcoming uptick in price and a potential entry point for a bullish trade position.
Origins and Importance in Technical Analysis
William J. O’Neil’s contributions have been pivotal in cementing the cup and handle pattern’s prominence within the scope of technical analysis. This price pattern is not merely a set of lines on a chart; it encapsulates investor psychology and market dynamics. Its presentation on a security chart acts as a precursor to a bullish continuation, drawing the attention of investors to prime buying opportunities just before an anticipated increase in the market value.
Key Characteristics of a Valid Cup and Handle
A valid cup and handle formation must adhere to certain criteria to be considered reliable. Firstly, the cup’s form should be a well-defined “U” shape, as opposed to a more abrupt “V,” providing a more gradual and natural bottoming out. The depth of the cup should be moderate, aligning with a balanced price consolidation phase rather than an overextended drop, thus maintaining the integrity of the formation. The handle must form within the upper region of the cup, hinting at accumulation and presaging an imminent breakout. A critical aspect is the shift in trading volume: it should decrease as the cup reaches its apex, followed by an increase during the break past previous resistance points.
Investors and traders looking to harness the full potential of the cup and handle pattern must pay close attention to these nuances. It’s the nuanced interplay of volume trends and price consolidation within this distinct formation that offers up a snapshot of market sentiment, directly influencing decision-making in technical trading.
Identifying a Cup and Handle Pattern on Weekly Chart
For seasoned and novice investors alike, recognizing a cup and handle pattern on a weekly chart is essential. This classic technical chart pattern is a harbinger of a bullish continuation, often leading to a sizable breakout. Mastery of this pattern enables traders to capitalize on breakout signals, but it requires an understanding of its subtleties.
The inception of the pattern begins with a prior trend, typically bullish, which is critical for the cup and handle to be considered a continuation pattern rather than a reversal. A valid cup has a smooth “U” shape, indicative of a bottom rounding out with resilience and optimism in the market. Conversely, a “V” shape suggests a more volatile market and does not typically align with the steady momentum implied by the cup and handle.
Following the formation of the cup, the handle develops through a minor pullback, proceeding the anticipated breakout. Patience is key here, as the handle’s formation should not be abrupt but rather a slow decrescendo in price movement and volume, culminating in a climb once the resistance is penetrated.
- Cup Depth: Retrace no more than one-third to half of the prior advance.
- Handle Retraction: Ideally remain within one-third of the cup’s highs.
- Timeframe for Formation: Cup formation from one to six months and handle formation to conclude within one to four weeks.
- Volume: Noticeable increase supporting breakout.
Identifying the correct moment to act on a cup and handle formation is also a balance of confirmation and timeliness. A premature entry might fall victim to a false signal, while a delayed one might miss out on the breakout’s rewards.
Here’s a snapshot of a well-formed cup and handle pattern:
Ultimately, the recognition of a cup and handle pattern on a weekly chart not only involves an appraisal of the shape and volume but also a strategy ready to engage the moment a breakout signal materializes. In this interplay of patience and action, the avid chartist finds their edge in the rhythm of the markets.
The Psychological Dynamics Behind the Cup and Handle Pattern
Discerning the subtleties of market behavior and its impact on price formations is critical for traders. The cup and handle pattern, a prominent chart formation, is not solely a reflection of market trends, but also embodies the underlying psychological battles waged by investors. As the pattern develops, understanding the dual narrative of trader sentiment and volume trends becomes paramount for trading success.
Investor Sentiment During the Formation
At the very heart of the cup and handle’s formation lies a test of investor sentiment. As the stock nears its previous highs, the onset of selling pressure is almost guaranteed. This pressure stems from the hesitation of investors to push prices beyond established resistance levels, leading to what’s known as price consolidation. This vital phase often mimics a downtrend and can span several days, if not weeks. During this time, investor behavior reflects a mix of uncertainty and anticipation for the stock’s ability to break past its historical ceiling.
Volume Trends and Their Indicators
Trading volume offers a quantifiable glimpse into the pattern’s integrity. As the cup reaches completion, a noticeable decline in volume typically accompanies the reduction in price. This decreasing volume trend is crucial as the stock carves out the bottom of the cup, setting the stage for a potential reversal. Upon the ascent from the trough, a resurgence in volume signifies a bullish signal, instilling confidence in the pattern’s validation. This tells traders that the market is gaining interest and conviction as the price prepares to challenge its former peak and possibly break through into a sustained uptrend.
Trading Strategies Based on the Cup and Handle Pattern
The cup and handle pattern, recognized for its technical breakout potential, provides traders with detailed scenarios for entering and managing trades. By implementing strategic entry points and utilizing robust stop-loss strategies, traders can engage in long positions with greater confidence and risk management. An understanding of this pattern aids in establishing profit targets that align with the anticipated upward trend intensification.
Entry Points and Position Sizing
For those looking to capitalize on the technical breakout signified by the cup and handle pattern, the trading entry is pivotal. A sound entry strategy revolves around confirming a breakout above the handle. By taking a long position after a definitive close above this threshold, traders mitigate the risk of false signals. Position sizing is equally critical and should be calculated based on the current volatility and the individual’s risk appetite.
Setting Profit Targets and Stop-Loss Orders
Establishing clear profit targets and stop-loss orders can significantly contribute to successful risk management. The depth of the cup often determines the profit target, suggesting an upward projection from the point of breakout. Conversely, a stop-loss order should be tactically placed, either below the handle or the base of the cup, to protect against potential downturns while allowing room for the trade to mature.
| Pattern Feature | Entry Strategy | Profit Target | Stop-Loss Position |
|---|---|---|---|
| Handle Breakout | Enter after price closes above the handle | Depth of the cup added to breakout level | Just below the handle or cup base |
| Volume Increase | Confirm with surge in volume | Match with past price resistance areas | Adjust according to market volatility |
| Risk Tolerance | Calculate position size accordingly | Set realistic expectations based on chart history | Tailored to individual risk profile |
Conclusion
The cup and handle pattern, a key formation within the realm of technical analysis, stands as a robust indicator of bullish market trends. Essential for those who navigate the intricate world of stock trading, this pattern harnesses the collective sentiments of market psychology and crucial volume shifts to signal impending movements. It’s the keen observation of these chart patterns that empowers traders to detect compelling buying opportunities and craft strategically sound entry points.
Nevertheless, the utilization of the cup and handle requires more than pattern recognition; it demands a disciplined approach to market evaluation. No chart pattern, including the cup and handle, should dictate market movements unchallenged. It is integral that traders augment the insights offered by these patterns with a comprehensive analysis of the markets, informed by a mosaic of other technical indicators and macroeconomic observations.
Ultimately, the true artistry of trading lies in synthesizing the information conveyed through various signals—technical, fundamental, and contextual—melding them into a cogent strategy. The cup and handle pattern is but one aspect of this intricate tapestry, and when woven into a broader tactical framework, it can serve as a powerful tool in the trader’s arsenal for harnessing the ebbs and flows of market trends.


