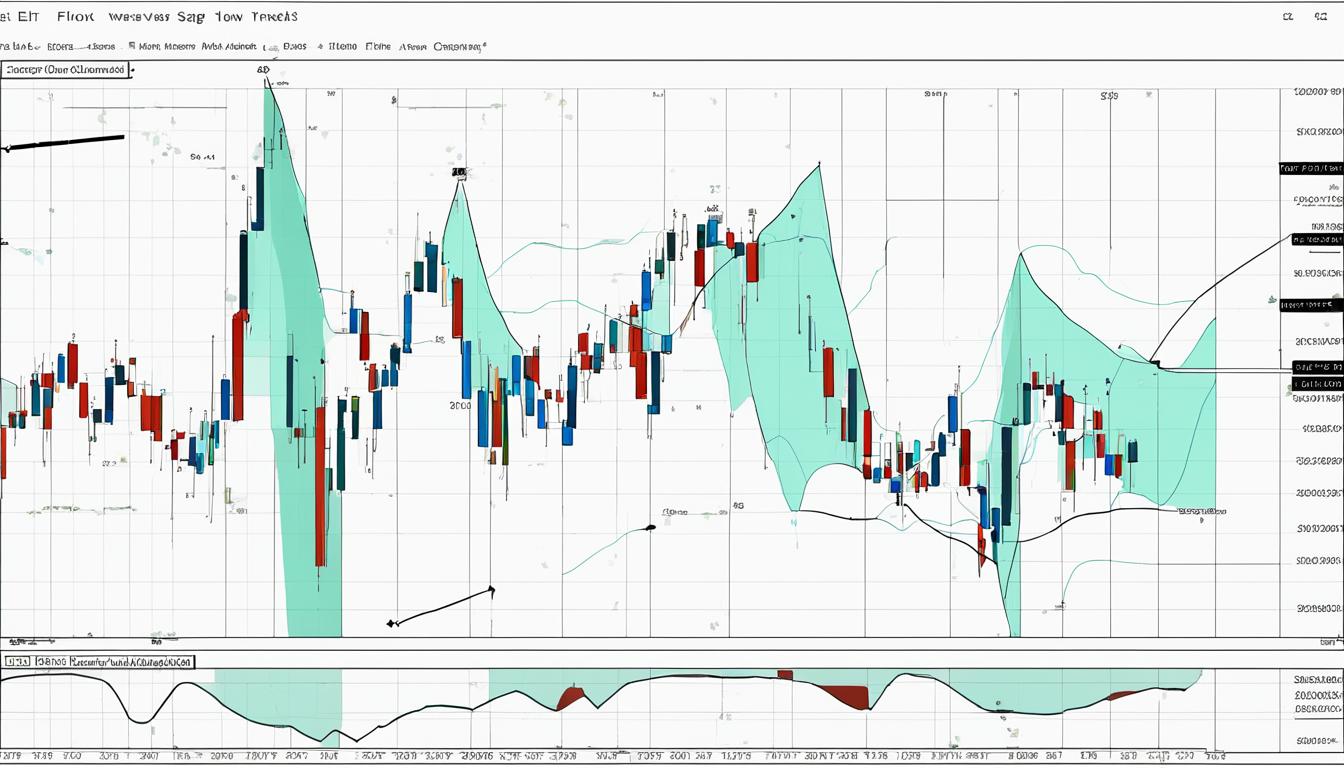
Understanding and capitalizing on market trends is the cornerstone of profitable trading. The concept of ‘trade with the trend’ forms the essence of numerous market strategies that aim to sync with the market’s natural ebb and flow. Yet, leveraging trends to maximize investment returns is both an art and a science. One of the key philosophical pillars in this realm is the Elliott Wave Sage, an analytical approach that dissects market trends analysis through the lens of rhythmic and repeated patterns.
Distinguishing between the myriad temporal layers of market behavior is vital to both short-term trades and long-term portfolio gains. While intraday traders might focus on granular fluctuations, long-term investors pay heed to broader, more significant trend movements. The art of trading styles—whether it’s intra-day, swing, or position trading—necessitates a nuanced approach to market trends analysis, hinged upon an intricate understanding of market waves that can forecast the trajectory of prices.
Implementing tools such as the 20 period Exponential Moving Average (EMA) and the 55 period Simple Moving Average (SMA) is more than just a technical exercise; it’s a strategic enabler for discerning the direction of major currencies, like the euro’s rise or fall against the dollar. As these averages converge or diverge, they offer predictive insights into potential reversals or continuations of trends, empowering traders to make calculated decisions aligned with the market’s pulse.
At its essence, the market communicates through waves—impulse waves that signify the momentum of a trend, and corrective waves that reflect a pause or regression. The Elliott Wave Sage perspective enhances traders’ foresight into these levels, where a pattern of five ascending swings or three descending dips could unlock the door to predicting market behaviors. Grasping these concepts can transform a speculative endeavor into a tapestry of intelligent bets, sharply increasing the effectiveness of each trade launched in the world’s most dynamic marketplace.
Understanding the Elliott Wave Principle
The Elliott Wave Principle stands as a testament to the predictive power of wave patterns in financial markets. By meticulously charting the ebb and flow of investor sentiment and calculating specific elliott wave levels, this advanced analytical tool has revolutionized the way traders interpret market phases and forecast trends.
Origins and Development of Elliott Wave Theory
Conceived by Ralph Nelson Elliott in the 1930s, the Elliott Wave theory has garnered a substantial following among trading professionals. Elliott’s observation that markets move in distinctive patterns, driven by the collective psychology of market participants, introduced a new avenue for market analysis. His insights laid the groundwork for a comprehensive method of charting market cycles, which has been refined over decades by practitioners of the principle.
Interpreting Market Phases with Elliott Waves
The essence of Elliott Wave theory lies in its ability to dissect market trends into principal phases. By categorizing the price movements into impulse waves, which denote the predominant market direction, and corrective waves, indicative of a minor pullback against the trend, analysts can create a roadmap of potential future price action. A keen understanding of these patterns enhances the trader’s ability to discern the market’s phase within its overarching trend.
The Importance of Correct Analysis for Trading Success
Meticulous attention to wave counts and configurations is not merely an academic exercise; it is central to unlocking the benefits of the Elliott Wave Principle. Successful application of this analytical approach can illuminate trading opportunities with precision, allowing traders to pinpoint optimal entry and exit points. In the hands of a skilled analyst, the Elliott Wave theory transforms from an abstract concept into a practical tool, pivotal for attaining trading success and interpreting the intricacies of market phases.
The Basics of Market Trends and Their Significance
Grasping the market trends basics is essential for any investor or trader aiming to navigate the complexities of financial markets. A trend can be understood as the overarching direction in which a market is moving, be it upwards, downwards, or sideways. Recognizing these trends is not merely an academic exercise; it lies at the core of trading with the trend, whereby investors seek to align their strategies with the momentum of the market.
An examination of trend significance reveals how trends act as a compass in the wilderness of market fluctuations. They provide invaluable context, helping traders discern whether a security is in a phase of accumulation or distribution. This insight informs decisions on trade timing, risk management, and potential profit targets.
Moreover, the prevailing trend offers a lens through which market sentiment can be viewed. A strong uptrend may reflect optimism and a positive outlook for the underlying asset, while a downtrend might indicate pessimism or fading confidence. In practical terms, aligning one’s trading positions with the dominant trend can potentially increase the probability of successful trades.
Traders utilize a variety of technical indicators and chart patterns to identify and confirm trends, but foundational to all these tools is the concept of higher highs and higher lows for uptrends, or lower highs and lower lows for downtrends. By emphasizing trends within different time frames, investors can shape their approach to suit their trading style, from day trading to long-term investing.
| Time Frame | Significance | Trend Identification |
|---|---|---|
| Intraday | Essential for day traders and scalpers | Minute to hour charts |
| Short-Term | Important for swing traders | Hour to daily charts |
| Long-Term | Crucial for position traders and investors | Weekly to monthly charts |
Whether a trade is conducted over the course of hours or held for months, the guiding principle of adhering to the trend remains a cornerstone of market analysis. By understanding the undeniable significance of trends in the financial markets, one can better navigate the ebb and flow of asset prices, making informed decisions grounded in the realities of market dynamics.
Identifying Turning Points with Moving Averages
Moving averages serve as foundational indicators for chartists and traders, offering a simplified view of the market’s trend direction and momentum. The utility of moving averages extends beyond just trend identification; they are robust tools employed for market timing and pinpointing critical trend reversals. This section delves into the nuances of simple moving averages (SMAs) and exponential moving averages (EMAs), elucidates the pivotal role of moving average crossovers in trade signaling, and scrutinizes the strategy of market timing through coordinated moving average pairs.
Difference Between Simple and Exponential Moving Averages
The choice between a simple moving average (SMA) and an exponential moving average (EMA) can influence the responsiveness of the signals received. An SMA is calculated by averaging a security’s price over a specific period, providing a smoothed representation of price movement. This simple method grants equal weight to all price points within the period. Conversely, an EMA applies a greater emphasis on recent prices, leveraging a multiplier that exponentially decreases the weight of older prices. This results in an EMA being more sensitive to recent price swings, therefore, it can offer earlier signals for market entry and exit points compared to the lagging nature of an SMA.
Interpreting Moving Average Crossovers
Moving average crossovers are a cornerstone of technical analysis, highlighting intersections between short-term and long-term moving averages as potential indicators of trend changes. A bullish crossover occurs when a short-term moving average, such as the 10-day EMA, ascends through a longer-term moving average, like the 50-day SMA, suggesting upward momentum and possibly signifying an opportune buying moment. Alternatively, a bearish crossover—a short-term moving average plummeting below a long-term one—may flag a sell signal, hinting at downward pressure. These crossovers are considered significant by traders as they often precede major price movements.
Timing the Market with Averages Moving in Pairs
Analyzing the interaction of moving averages in pairs allows for more precise market timing, distinguishing the prevailing trend’s strength and foreshadowing reversals. Traders monitor a combination of a shorter and a longer moving average to gauge overall trend direction and velocity. As the shorter average deviates away from the longer average, it can signal an acceleration in trend direction, which could be indicative of a continuation or an impending exhaustion. The space between the two averages, known as the ‘spread,’ can reveal the momentum’s intensity — a widening spread suggests strong momentum, while a narrowing one may precede a trend slowdown or reversal.
Elliott Wave Sage: Implementing Strategic Trade Planning
Deploying the principles of Elliott Wave Sage into trading practices ushers in a new echelon of strategic trade planning. It harnesses the predictive power of wave patterns to forge high-precision trade decisions and proactively adjusts strategies to stay aligned with the fluid dynamics of financial markets.
How Elliott Wave Sage Methodology Can Improve Trade Accuracy
Trade accuracy is at the heart of successful trading strategies. The Elliott Wave Sage methodology offers traders a systematic approach to dissect market structures, enabling a precise identification of trend phases and turning points. By incorporating such rigorous analysis, traders elevate their foresight, reducing guesswork and substantially improving the precision of their trades.
Utilizing Wave Counts for Entry and Exit Decisions
Wave counts are not a mere analytical tool but a foundation for key trade executions. Each count signifies potential junctures for optimal entry and exit points. Traders leaning on the Elliott Wave Sage framework can thus synchronize their trades with the inherent rhythm of the market, ensuring that each move is timed not on a whim, but on credible wave-based forecasting.
Adjusting Trading Strategies to Wave Predictions
Adaptation is key to longevity in the trading world. As market conditions shift, so must the strategies employed. The Elliott Wave Sage emphasizes the value of adaptive trade planning. By accommodating wave counts into strategy formulation, traders can nimbly adjust to market fluctuations—shrinking potential losses and maximizing potential gains.
| Wave Phase | Market Condition | Strategic Response |
|---|---|---|
| Impulse Wave | Bullish Trend | Seek entry points aligned with upward momentum |
| Corrective Wave | Consolidation/Reversal | Prepare for potential exit or against-the-trend positions |
| Completion of 5-wave Cycle | Trend Exhaustion | Evaluate for reversal signals; tighten stop-loss |
Integrating the acumen of Elliott Wave Sage with strategic trade planning broadens the horizon for traders, setting the stage for a disciplined, accuracy-focused, and adaptable trading ethos that resonates with the pulse of contemporary markets.
Advanced Techniques in Elliott Wave Analysis
The art of Elliott Wave analysis has long been a cornerstone for savvy traders looking to gain an upper hand in the volatile landscape of market forecasting. Armed with advanced techniques in understanding wave patterns, these traders scrutinize the markets with an analytical eye, discerning not just simple price movements but the intrinsic patterns that signal broader trends and shifts. Mastery of these sophisticated methods is not just about recognizing the standard structures of impulse and corrective waves; it involves diving into the nuanced realms of complex wave formations.
For those who excel in Elliott Wave analysis, it’s the ability to identify and interpret what many may overlook that sets them apart. Extensions, typically seen as prolonged waves within a dominant trend, offer clues of sustained market sentiment, whereas truncations can abruptly defy expectations, signaling weaker movements that fall short of their predicted lengths. Diagonal formations, often occurring at the commencement or termination of a trend, require a keen understanding of both motive and corrective phases within the Elliott Wave framework. It’s through honing these advanced techniques that forecasters can anticipate market movements with a precision that is grounded firmly in well-established and scientific methods.
In the realm of financial trading, where uncertainty is the only certainty, proficiency in market forecasting using the Elliott Wave principle can be likened to a strategic game of chess. Each move, informed by exhaustive analysis and a thorough grasp of advanced wave patterns, can determine the difference between a modest trader and an undisputed market sage. The intricate dance of waves tells a story — and for those fluent in Elliott Wave language, it’s a narrative rich with potential and opportunity.


