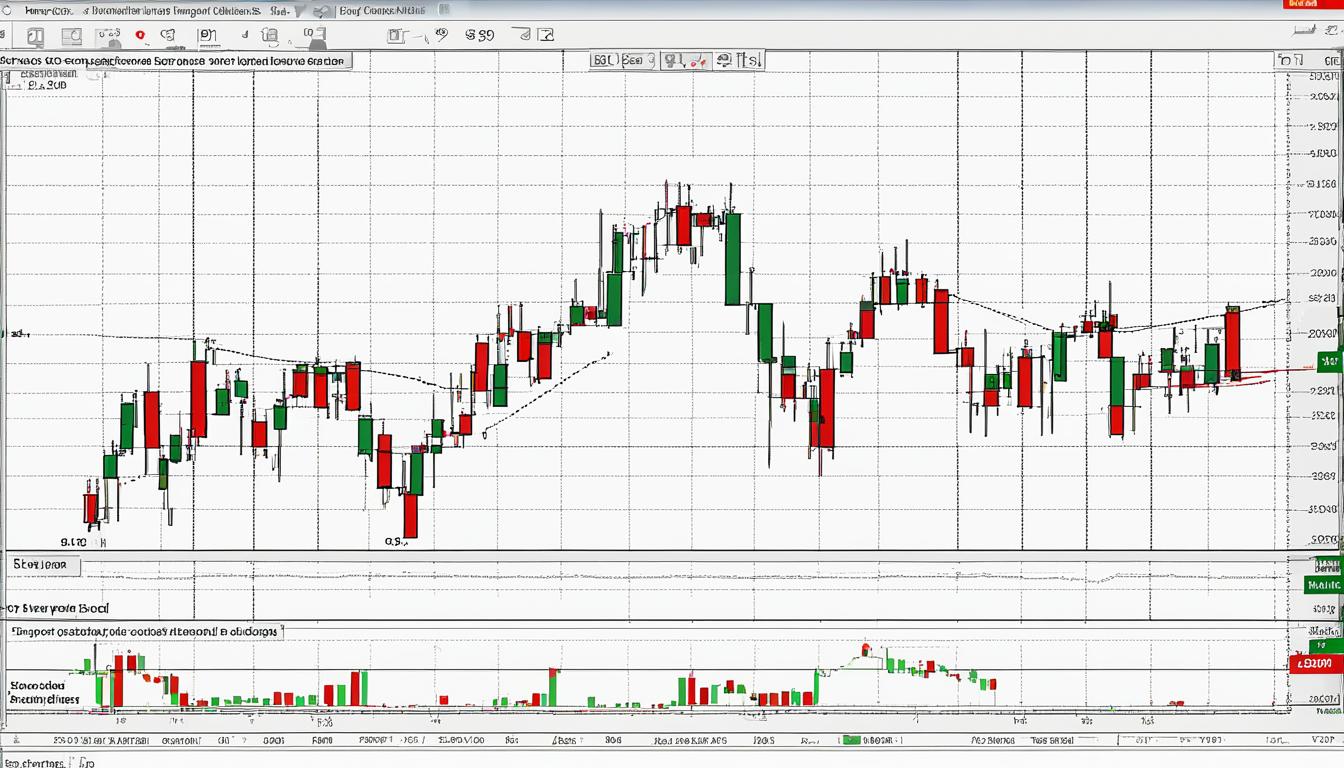
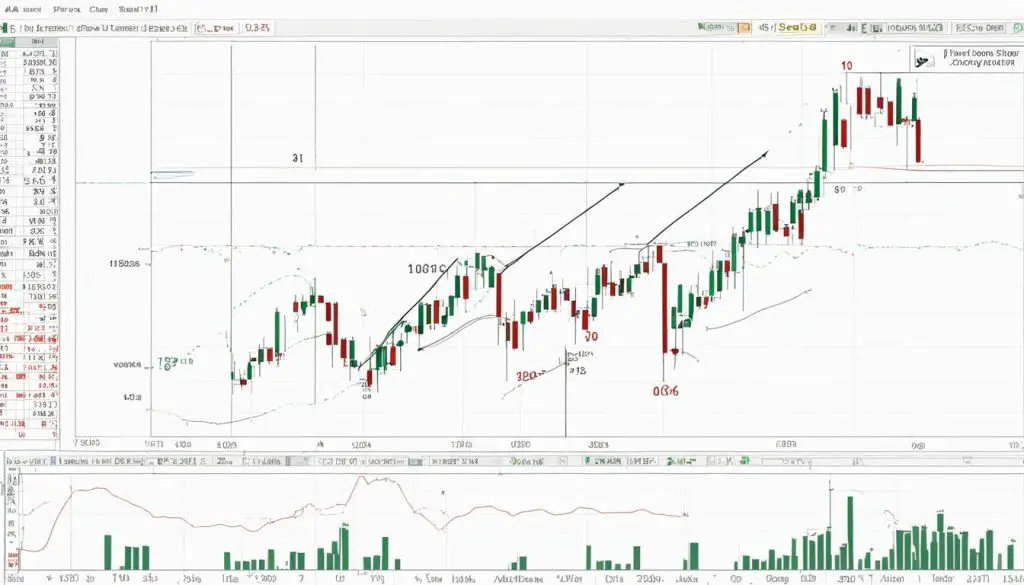
The landscape of financial spread betting is replete with opportunities and risks, particularly when dealing with trading reversal patterns. Among them, the failed inverse head and shoulders pattern stands out as a poignant example of market unpredictability. This formation, coveted by traders for its bullish reversal promise, is complex and often misunderstood, sometimes leading to unexpected downtrends when the anticipated upward momentum falters.
Mastering the nuances of such patterns is critical for anyone engaging in the high-stakes game of trading. Recognizing the early warnings of a failed inverse head and shoulders pattern can make the difference between capitalizing on shifts in market trends and succumbing to costly misdirection.
For investors relying on technical analysis, it is essential to understand the factors that contribute to a pattern’s failure. This knowledge not only guards against potential losses but also informs more strategic decisions in the unpredictable world of financial spread betting.
Understanding the Inverse Head and Shoulders Pattern
The inverse head and shoulders configuration stands as a pivotal structure in technical analysis, marking potential transitions in market trends. Recognizing this pattern and deciphering its subsequent messages about market sentiment provides a strategic advantage. For investors and traders, the ability to interpret this formation is vital in forecasting a bearish to bullish trend shift.
Identification and Formation of the Pattern
Characteristic of a reversal, the inverse head and shoulders pattern surfaces after a downtrend, hinting at an impending shift. It graphically represents seller exhaustion, showcasing a trio of troughs with the deepest being the central ‘head’. The adjoining troughs – the ‘shoulders’ – are relatively shallower and often symmetrical. The ‘neckline’ becomes the crucial resistance level; it’s a trendline which connects the high points subsequent to the head and shoulders.
Psychological Dynamics Behind the Pattern
Trading psychology plays an intricate role in the formation of this pattern. Investors transition from a state of skepticism to one of cautious optimism, inciting pivotal market movements. The inverse head and shoulders pattern embodies this sentiment shift. Typically, the formation of the left shoulder occurs amid widespread bearish sentiment, where traders might engage in panic selling, further intensifying the downtrend.
Volume Interpretation During Pattern Development
At the crux of assessing the strength of the inverse head and shoulders pattern lies volume analysis in trading. The left shoulder formation is often accompanied by declining volume, illustrating the waning momentum of the bearish trend. As the head forms, there is usually a spike in volume, signifying the capitulation point, where the lowest prices generate increased activity. Most significantly, a breakout with high volume above the neckline serves as a neckline confirmation, endorsing the authenticity of the reversary shift from bearish to bullish momentum.
Indicators of a Potential Failed Pattern
Within the realm of technical analysis, the failed inverse head and shoulders pattern is a critical formation that traders monitor to gauge market direction. Certain indicators can hint at a potential neckline breach that may lead to a trend reversal failure, suggesting the previous downtrend may persist. Recognizing these early signals is essential for risk management and can impact the traders’ decision-making process.
One of the primary indicators of a failed pattern is when the price struggles to maintain its position above the neckline despite an initial breakthrough. This failure to sustain the breakout often precedes a reversion to the favour of bearish sentiment. To better understand the intricacies of this occurrence, we can discuss the following signs:
- An immediate neckline breach post-breakout, indicating a lack of bullish support.
- Prior support and resistance levels not aligning with the breakout trajectory.
- Retracement percentages of the former uptrend failing to validate the bullish momentum.
- Subdued or inconsistent volume during the breakout phase, signaling a lack of conviction among buyers and forecasting the likelihood of pattern failure.
A diligent observer of market patterns should consider these warning signals as a preemptive alert against possible reversal failures and maintain a cautious position. The failed inverse head and shoulders pattern serves as a telling reminder that while technical analysis can guide traders, it remains an art subject to the whims of market forces and investor psychology.
Analyzing the Role of Market Volume in Pattern Success or Failure
Within the sphere of technical trading, a comprehensive market volume assessment plays a pivotal role in verifying the strength of trading patterns. The inverse head and shoulders pattern, a chart formation signaling a trend reversal, relies heavily on volume to substantiate its credibility. Understanding the nuanced interplay between volume and price movements can furnish traders with the foresight needed to predict pattern success with greater accuracy, leading to confident decisions in their trading ventures.
Volume Trends and Their Significance
For a technical analyst, the volume trend is not merely a background metric but a core element that contributes to inverse head and shoulders validation. During the pattern’s build-up, descending moves may not showcase significant volume, but the validity of an upward breakout is often directly correlated with a surge in volume. This relationship underscores the critical nature of volume when forecasting the momentum and potential endurance of a trend reversal.
Contrasting Volume on Breakouts vs. False Signals
Contrasts in volume observed during pattern formation can often elucidate the underlying market conviction, or lack thereof. A genuine breakout confirmation is often characterized by an appreciable spike in volume, marking the participation of a wider market subset and endorsing the anticipative bullish sentiment. Conversely, a tepid volume display may foretell a tepid breakout, warning astute traders of a potential fallback and subsequent pattern invalidation.
| Pattern Phase | Volume Expectation | Success Indicator | Failure Indicator |
|---|---|---|---|
| Left Shoulder | Moderate | Elevated above trend | Subdued relative to trend |
| Head Formation | Low to Moderate | Recovery rally with increasing volume | Continued low volume |
| Right Shoulder | Moderate to High | Growing volume as prices ascend | Lackluster volume; price stalls |
| Breakout | High | Significantly higher volume confirming breakout | Volume does not support the breakout |
Traders who master the art of correlating volume trends with price action can skillfully navigate the choppy waters of technical pattern analysis. A meticulous evaluation of volume—not just in magnitude, but in its consistency and timing—can markedly reduce the uncertainty inherent in speculation, carving out opportunities for enhanced predictive precision and imparting a strategic edge in the competitive arena of trading.
Strategic Trading Approaches with Inverse Head and Shoulders
The inverse head and shoulders trading template is pivotal amongst technical analysis strategies, commonly deployed for identifying bullish reversal tactics. Mastery of this pattern provides traders with robust entry and exit signals, imperative for capturing profit opportunities in the markets.
To execute this strategy, keen observation is required to discern the precise moment of a pattern’s completion. The hallmark of a valid inverse head and shoulders formation is a surge in volume, which affirms the pattern’s integrity and the impending bullish reversal.
Once the pattern is confirmed, a trader may take a long position. When devising an entry plan, it’s recommended to place a stop loss just below the lowest point of the right shoulder. This risk management technique ensures that traders can minimize potential losses if the market moves against their position.
Calculating the target price is a crucial step following the establishment of a position. The target is typically derived by measuring the distance from the neckline to the head’s trough, then projecting this distance upwards from the point of breakout at the neckline. This projection offers a quantifiable profit objective for the trader.
- Entry strategy: Wait for volume-confirmed breakout above the neckline.
- Stop loss placement: Below the lowest point of the right shoulder to safeguard against unexpected downturns.
- Profit targets: Measure from head’s trough to neckline, extend this distance upward from breakout for potential exit.
- Additional confirmations: Employ other technical indicators such as MACD, RSI, or Stochastic Oscillators for further validation.
- Time frame preference: Patterns observed on daily or weekly charts are deemed more reliable than those on shorter timeframes.
By integrating the inverse head and shoulders pattern with a prudent and disciplined approach, traders gain entry to a comprehensive toolbox that incorporates time-tested technical analysis strategies and bullish reversal tactics, enhancing the potential for successful trade execution in a variety of market environments.
Case Studies: Real-World Examples of Failed Patterns
Analyzing historical case studies provides traders with a deeper understanding of the dynamics behind failed inverse head and shoulders examples. These real-world events highlight the importance of rigorous investment strategy analysis, and how trend prediction errors can influence market outcomes. Below, we delve into two case studies that exemplify the critical learning points from such occurrences.
Understanding the Impact of Failed Breakouts
One notable case occurred with the QQQ ETF, a popular fund reflecting the tech-heavy NASDAQ-100 index. Traders observed a formation that closely resembled an inverse head and shoulders pattern. However, following the breakout, the price failed to sustain its momentum, slipping back below the neckline. This movement invalidated the anticipated bullish trend, serving as a stark reminder of how crucial it is to account for false signals when developing trading strategies.
Learning from Historical Trade Data and Pattern Failure Rates
By assessing and comparing pattern failure rates, traders can refine their analytical skills. For instance, the analysis of the S&P 500 during the volatile markets of 2008 highlighted a variety of failed patterns, which taught traders to be warier of supposed bullish signals during times of economic distress. To better demonstrate this point, consider the following table of two failed patterns and their observed outcomes:
| Financial Instrument | Date | Pattern Observation | Price Pre-Breakout | Price Post-Failure | Impact of Failure |
|---|---|---|---|---|---|
| QQQ ETF | February 2021 | Failed inverse head and shoulders | $330 | $300 | Negative reversal confirming trend weakness |
| S&P 500 Index | October 2008 | Multiple false bullish signals | $1,200 | $850 | Continuation of bear market amid financial crisis |
The insights derived from such trading case studies not only underline the occurrence of trend prediction errors but also shed light on the necessity for comprehensive investment strategy analysis. As patterns evolve, the savviest of traders know that a single failure should not deter them but rather equip them to identify and capitalize on genuine opportunities.
Conclusion
In the intricate dance of financial markets, the inverse head and shoulders pattern has long been seen as a trustworthy beacon, signaling a bullish reversal after a bearish trend. However, as we’ve dissected throughout this analysis, the pattern’s reliability is not without its caveats. Discerning traders appreciate that the real merit lies in the keen observation of details—particularly, committing to understand the complexities of volume confirmation and the subtle psychological pivots within the trading community.
Future Prospects for Trading Inverse Head and Shoulders Patterns
The inverse head and shoulders outlook remains broadly positive, with the acknowledgment that no indicator is infallible. Enhancing pattern recognition with evolving analysis tools and staying abreast of market sentiments serve as the cornerstones for future trading tactics. While history may not always repeat itself, it often rhymes, allowing astute traders to harness the cyclical nature of markets. Thus, refining approaches to pattern trading, with a heavy emphasis on reliability evaluation, will be critical.
Risk Management Strategies Post Pattern Failure
The occasional failure of an inverse head and shoulders pattern is not an anomaly but an inherent risk in trading. To ensure these failures don’t morph into catastrophic losses, trading risk management takes center stage. Successful traders learn from these scenarios, integrating stringent stop-loss orders, and employing diversification to buffer against unexpected reversals. Agile adaptation to market flows, married with continuous learning, crystallizes the resilience of investment strategies. Consequently, these practices bolster a trader’s capability to navigate the capricious market currents effectively, even when faced with pattern discrepancies.


