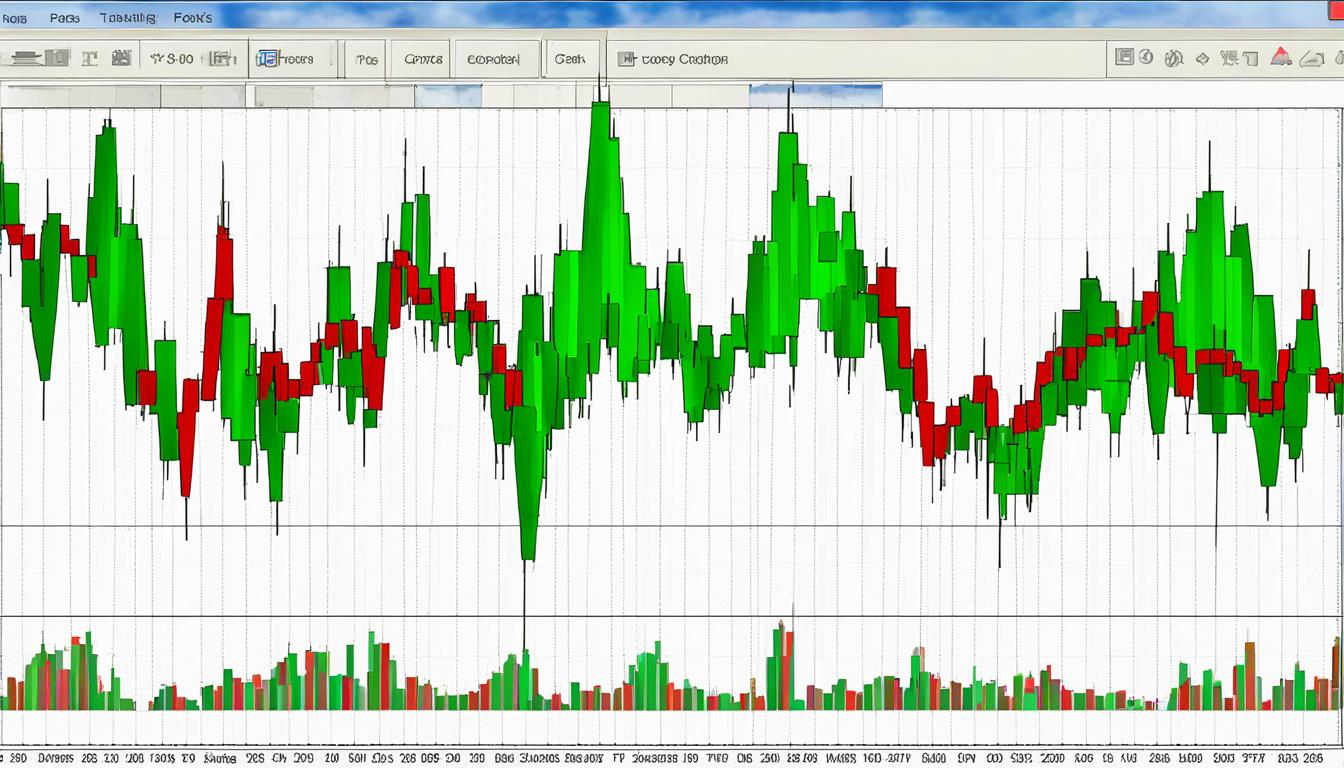
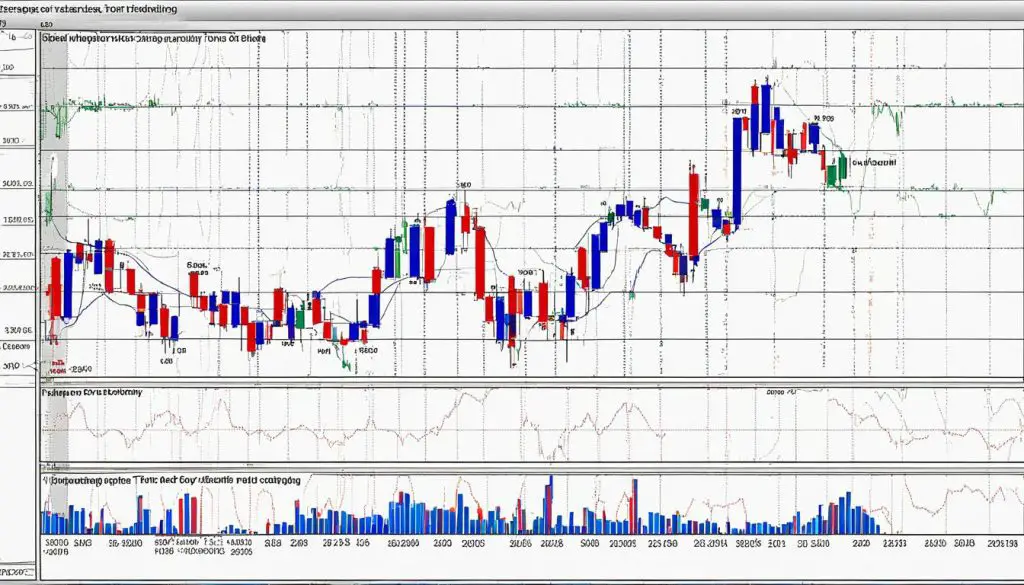
In the pursuit of enhancing portfolio returns, discerning traders continually seek out robust trading strategies that can provide a competitive edge. Among the various techniques available within technical analysis, multiple top trading stands as a pivotal methodology. These chart patterns are not just visually striking but are also indicative of potential trend reversals, making them essential for those aiming to maximize trading profits.
Within this realm, the double top pattern emerges as a noteworthy formation. This bearish technical reversal is recognizable by its two adjacent peaks, suggesting that a price level has been tested and held firm twice. Traders adept at identifying and interpreting this pattern are often well-equipped to make strategic exits or initiate short positions. As we delve deeper into these chart formations, it’s critical to understand not only their theoretical underpinnings but also the real-world implications and applications in the markets.
Understanding Multiple Top Patterns in Technical Analysis
In the realm of technical analysis, the study of chart patterns plays a pivotal role in identifying market sentiment and potential trend reversals. Among these critical figures, the multiple top patterns, and specifically the notorious double top, command attention as potential precursors for a bearish reversal pattern. Drawing on trend analysis, these patterns help astute traders to gauge support levels, anticipate resistance points, and map out coherent trading patterns. Let’s delve deeper into the mechanics of this influential chart configuration.
Defining a Double Top Reversal
The double top reversal is frequently encountered by traders monitoring resistance levels within an asset class. Emblematic of a bearish shift, this pattern manifests as two distinct peaks at a similar price level, underscoring a stalled bullish momentum failing to push past a resistance threshold. This configuration is not only a signal to investors of waning buying pressure but also serves as an indicator to consider potential short selling opportunities or exit existing long positions.
Indications of a Trend Change
A keen-eyed investor recognizes the double top as more than just a chart pattern; it is a harbinger of a potential trend shift from bullish to bearish. The inability of an asset’s price to break through a resistance level not once but twice is telling; it reveals underlying market dynamics where sellers are overpowering the once-dominant buyers, possibly resulting in a trend reversal that could impact medium or long-term positions.
Key Identification Steps of Double Tops
The recognition of a double top pattern is methodical, requiring confirmation of several sequential events on a price chart. This includes the establishment of an initial high (the first peak), a subsequent drop (the trough), and a rebound to a second peak nearly equivalent in height to the first. The ‘neckline’—a term coined for the support level connecting the lowest points post each peak—becomes an area of significant interest. Once the price decisively breaks below this neckline, the pattern is confirmed, and the bearish reversal is acknowledged.
Comparison to Double Bottom Patterns
In contrast to the double top, a double bottom pattern signals the opposite effect—a bullish reversal. This optimistic counterpart is characterized by two lows, where the price has bounced back after attempting to dip below a support level. Though structurally mirrored, the psychological and market implications of the double bottom are distinctively different, highlighting the critical nature of accuracy in identifying these reversal signals and responding accordingly.
Let’s consider a practical example—large-cap stocks such as those in the technology sector are often scrutinized for these trading patterns. Historical chart data can shed light on instances where a failure to break through established resistance levels led to bearish reversals, exemplified by companies like Amazon and Netflix. Such cases solidify the importance of integrating chart patterns into an informed trading strategy.
Interpreting Market Signals with Double Tops
Within the spectrum of trading insights, the double top pattern stands out as a harbinger of impending price movements. This classic technical reversal typically indicates that an asset class has hit a peak, signaling traders about potential market shifts. With a robust presence in the charts of renowned instruments, such as Amazon and Netflix, these market signals represent pivotal moments for investors to gauge the pulse of the market.
Interpreting double tops goes beyond the recognition of the pattern’s shape; it requires an analysis of how these formations relate to broader market signals. The two peaks, indicative of a struggle to break through established resistance levels, suggest that an asset’s bullish momentum is waning. Meanwhile, the ensuing drop below a well-defined support level confirms the bearish outlook, allowing traders to align their strategies with the anticipated downturn.
- Peak Resistance: The initial sign of a potential double top is the asset failing to break through a high resistance level.
- Support Breach: The confirmation of a double top occurs with the asset price dropping below the support level.
- Asset Response: Comparative analysis of response from different asset classes provides enriched trading insights.
- Historic Confirmation: Past market signals from double tops in robust markets reinforce the pattern’s significance.
| Asset Class | Resistance Level (Approx.) | Support Level Breach Confirmation | Subsequent Price Movement |
|---|---|---|---|
| Amazon | $3,500 | Yes | Significant Drop |
| Netflix | $550 | Yes | Sharp Decline |
The ability to forecast potential price drops through double top patterns empowers traders with the foresight to minimize losses or even exploit the downturn for gains. Such foresight underscores why knowledge of market signals and technical reversals is indispensable for anyone keen on refining their market strategies and trading with a level of acumen that accommodates the inherent risks and volatility of trading.
The Significance of Volume and Neckline in Multiple Top Trading
In the landscape of technical chart patterns, multiple top trading is a critical method that utilizes formations, such as double tops, to forecast potential bearish turns in market trends. A crucial factor in recognizing the validity of these formations is the volume analysis. Typically, an increase in trading volume is observed as prices break below a significant support level, which helps in trading confirmation. Such volume spikes act as a reinforcing signal to the anticipated bearish price movements that follow a pattern confirmation.
The neckline significance cannot be overstated in the context of multiple top patterns. Serving as a demarcation line that defines the pattern’s support, the neckline represents a pivotal price level. A decisive close below this level is a strong confirmation of a bearish move to come, often resulting in traders setting up short positions in anticipation of further price decline.
Analysts and traders alike pay close attention to these elements, as they provide a structured approach to evaluate potential entries and determine support and resistance zones in market price movements.
| Pattern Element | Significance in Trading | Implication |
|---|---|---|
| Volume Increase | Confirms the bearish pattern through heightened trading activity as prices drop. | Bearish sentiment confirmation, increasing reliability of the pattern. |
| Neckline | A support line joining the lows between peaks signaling a potential sell-off upon breach. | Validity of the bearish reversal, setting clear benchmarks for trade execution. |
| Price Projection from Neckline | Helps in predicting the minimum expected downward price movement. | Enables trading target setting, optimizing entry and exit strategies. |
While chart patterns serve as pillars for predictive analytics in market trends, it is the synergy between volume, neckline breakouts, and price movements that creates actionable trading insights. Thus, a profound understanding of these aspects elevates the trader’s ability to navigate the volatility of financial markets with informed precision and confidence.
Conclusion
In summary, the application of multiple top patterns, especially the double top, carries potential for bolstering trading profits within the financial markets. However, a prudent trader must be mindful of the chart pattern limitations that accompany technical analysis. While double tops can indicate impending bearish movements, they are not infallible, emphasizing the need for confirmation and a cautious approach to interpret such setups accurately.
Maximizing Profits While Acknowledging Limitations
To navigate the complexities of chart patterns, traders should not solely rely on a single indicator but rather adopt comprehensive trading strategies. This balance allows for a nuanced perspective that recognizes the confluence of multiple signals, thereby mitigating the risk of misinterpretation and enhancing the probability of favorable outcomes. It is vital to integrate knowledge of volume, support levels, and the broader market analysis to substantiate any hypotheses that double tops may suggest.
Multiple Tops as Part of a Comprehensive Trading Plan
Embedding the insights gleaned from double top formations into a wider trading plan paves the way for more robust market participation. In harmonizing chart pattern analysis with other forms of technical assessment, traders can construct a versatile toolbox equipped to tackle the ebbs and flows of market volatility. Utilizing such comprehensive strategies stands as a pillar of technical trading best practices.
Encouraging Diligence and Continued Learning in Chart Analysis
The journey towards trading mastery is an ongoing process. It demands dedication and a commitment to continual learning, highlighting the importance of staying current with market trends and refining chart analysis skills. The dynamic nature of financial markets necessitates that even seasoned traders remain students of their craft, consistently applying the principles of diligence and education to strengthen their decision-making framework and trading discipline.
FAQ
What is a multiple top pattern in trading?
A multiple top pattern in trading, which includes the double top, is a chart pattern that signifies potential reversal points in the market. These chart formations are used in technical analysis to predict changes in the trend of an asset’s price. The pattern involves multiple peaks at around the same price level and is considered a bearish indicator when confirmed.
How can I maximize my trading profits using multiple top patterns?
To maximize trading profits using multiple top patterns, traders need to incorporate these patterns into their trading strategies, including careful technical analysis, prudent risk management, and understanding of market signals. Mastery of chart patterns, such as the double top, can help in identifying potential trend reversals and making informed trading decisions.
How can volume and the neckline influence the trading of multiple top patterns?
Volume and the neckline play significant roles in the trading of multiple top patterns. An increase in trading volume tends to confirm the bearish signal, as it suggests a stronger market consensus behind the price movement. The neckline, which is the support level connecting the lowest points between the tops, is crucial for confirming the pattern. A decisive break below the neckline suggests that the market has accepted the bearish reversal, making it a critical element for traders looking for confirmation.
Why is it important to be cautious with multiple top patterns in trading?
It is important to exercise caution with multiple top patterns due to the potential for false signals. Not all patterns will follow through with the anticipated reversal, so traders should seek confirmation through other technical indicators and be knowledgeable about the limitations of chart patterns to minimize the risk of misinterpreting the market signals.
How do I include multiple tops in a comprehensive trading plan?
Including multiple tops in a comprehensive trading plan involves using them as part of a broader strategy that considers a range of technical analysis tools, risk management techniques, and market contexts. It’s important to combine chart patterns with additional indicators and analysis for more reliable trade signals and to adapt strategies to meet individual trading objectives and risk tolerance.


