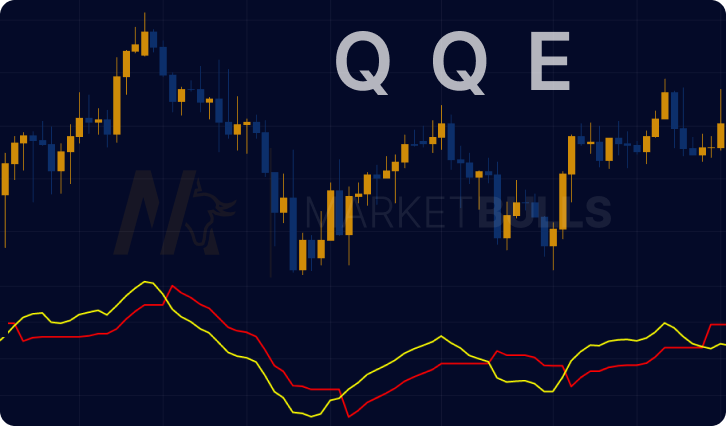
Unleashing the dynamics of momentum and volatility in trading is no small feat. The QQE Indicator, or Quantitative Qualitative Estimation, elegantly does this. Originating in the commodity markets, the QQE Indicator offers a unique blend of qualitative and quantitative data that helps traders identify potential market trends.
Unveiling the Mystery of the QQE Indicator
The QQE Indicator hinges on two key elements – the Relative Strength Index (RSI) and a specific smoothing technique. These elements are used to formulate two main lines: the QQE line and the signal line.
The QQE line is the result of modifying and smoothing the RSI, while the signal line is a simple Moving Average of the QQE line. The interplay of these lines is what provides trading signals to the observer.
How the QQE Indicator Comes to Life
The process of QQE Indicator calculation is intriguing. It all starts with the RSI, a tool for measuring the speed and change of price movements. While the RSI traditionally uses a 14-period setting, the QQE Indicator shortens this to a 5-period RSI, thus increasing the sensitivity to swift price action changes.
After determining the modified RSI, the QQE Indicator calculation applies Wilder's smoothing operator to it, resulting in the RSI Wilder.
Further Refining the QQE Indicator
Once the RSI Wilder is in place, it's time to add the QQE Mod Indicator and the QQE Signals, completing the QQE Indicator:
- The QQE Mod Indicator or Slow Trailing Line (STL) is a 14-period smoothed version of the RSI Wilder.
- The QQE Signals or Fast Trailing Line (FTL) involves a faster 5-period smoothing of the RSI Wilder.
Unearthing Trading Signals with the QQE Indicator
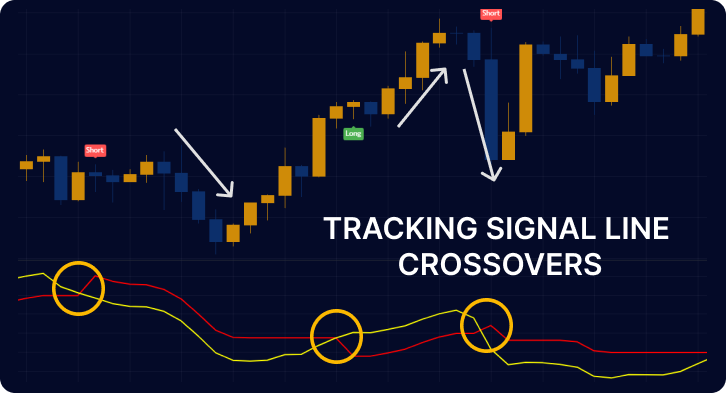
Trading with the QQE Indicator involves watching the QQE line, the signal line, and the trailing lines.
- A potential buy signal is when the QQE line crosses above the signal line, and the FTL crosses above the STL.
- Conversely, a sell signal might be when the QQE line crosses below the signal line, and the FTL crosses below the STL.

These signals aren't bulletproof, so combining the QQE Indicator with other indicators and analysis techniques can help confirm signals and reduce false positives.
An Example of Trading with the QQE Indicator
Let's visualize this with a practical example. Suppose you're trading a forex pair, say EUR/USD. You notice that the QQE line crosses above the signal line, and simultaneously, the FTL crosses above the STL. According to the QQE Indicator, this could be an optimal time to enter a long position.
You confirm this signal by checking other indicators, perhaps the Moving Average Convergence Divergence and see that it's also giving a bullish signal. Encouraged by these concurrent signals, you open a long position on EUR/USD.
Remember, no indicator can guarantee success, but a well-understood and correctly applied QQE Indicator can significantly increase the odds in your favor.
The Versatility of the QQE Indicator: MT4 and MT5
Popular trading platforms like MT4 and MT5 support the QQE Indicator. You'll find it in the custom indicators section on MT4 and in the oscillators category on MT5.
In Conclusion
The QQE Indicator, with its blend of quantitative and qualitative analysis, can be a game-changer in your trading strategy. Whether you're a novice or a seasoned trader, the QQE Indicator can offer you nuanced market insights. But remember, like all indicators, the QQE Indicator should be used alongside other analysis forms, like candlestick confirmations, for optimal results.
FAQ
Yes, the QQE Indicator is suitable for forex, stocks, commodities, and indices.
Absolutely. The QQE Indicator can be an effective tool for scalping when used with other indicators.
The reliability of the QQE Indicator, like all indicators, depends on market conditions and accurate signal interpretation.
Definitely. With understanding and practice, beginners can effectively use the QQE Indicator.
No, the QQE Indicator is effective across different time frames. However, longer time frames may improve accuracy.


