Japanese Candlesticks
Bullish & Bearish Candlestick Patterns – Candle Analysis & Signals
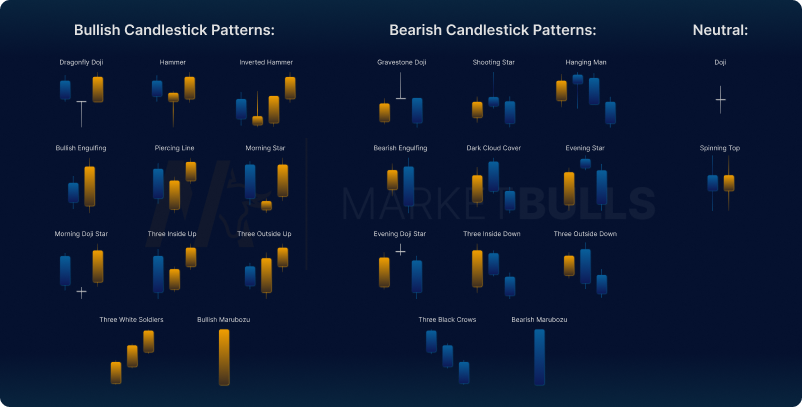
Get a deep understanding of all important Candlestick Patterns to confirm your trading ideas. MarketBulls provides an outstanding overview for all bullish, bearish & neutral candle patterns.

Candlestick Analysis
All Best Candlestick Patterns
Candlestick patterns are a popular technical trading tool used to interpret price data and forecast future price direction. Using these patterns, traders can recognize potential trend changes in the early stages of market movement. They should be used inline with other technical indicators.
Japanese
Candle Patterns
The most common candlestick signals are called Japanese candle patterns. The name has its origin in Japan, where the Japanese candle patterns as well as the candlestick chart was first seen.
Formations
Overview
With one of the best overviews on candlestick chart patterns, you can study the patterns individually and start implementing them into your trading to find profitable trading setups.
Candlestick
Signals
Whether bullish, bearish or neutral. Different patterns give various candlestick signals. Including reversal & continuation candle patterns ends in a clear understanding of price direction.
Neutral Formations
Candlestick Chart Patterns PDF
Cheat Sheet
With the MarketBulls candlestick pattern cheat sheet you are able to directly spot candle patterns in any market. Candlesticks can give great information about the actual trading period and insights on specific market behaviour.
All Candlestick
Pattern PDF
Get an overview about every important candlestick pattern to directly implement in your trading strategy. Keep in mind to not rely on any strategy that you have not backtested yourself.
Candle Chart
Signals PDF
Valid candlestick signals can be used as confirmations for other strategies. Candle signals are also interesting to trade theirself, when the underlaying fundamental analysis are inline.
Chart Patterns
Candlestick Trading
Candlesticks are used for trading to get more information about a market on a specific time period, as OHLC bars give much more information than a simple line charts. To trade candlestick patterns, you have to understand that they are not standalone trading signals. But with an underlying understanding of fundamental market behavior, cot data or seasonal tendencies they become high accuracy signals. Many traders are using candle patterns with trading indicators like EMA.
Technical Analysis
Candle Chart Analysis
The overall candlestick chart analysis includes not only candlestick tratding patterns and body to wick ratios, but also a whole top down technical chart analysis. Analyse the candlestick chart from top down. For candlestick chart analysis we recommend to use weekly, daily, 4h, 1h, 15m, 5m, 1m. Include 2 more higher timeframes in your candlestick chart analysis than you are trading on. For example, you are trading on the 1-hour chart. For your analysis you are inspecting the daily, 4h and 1h timeframe.

How To Trade A Candle Formation
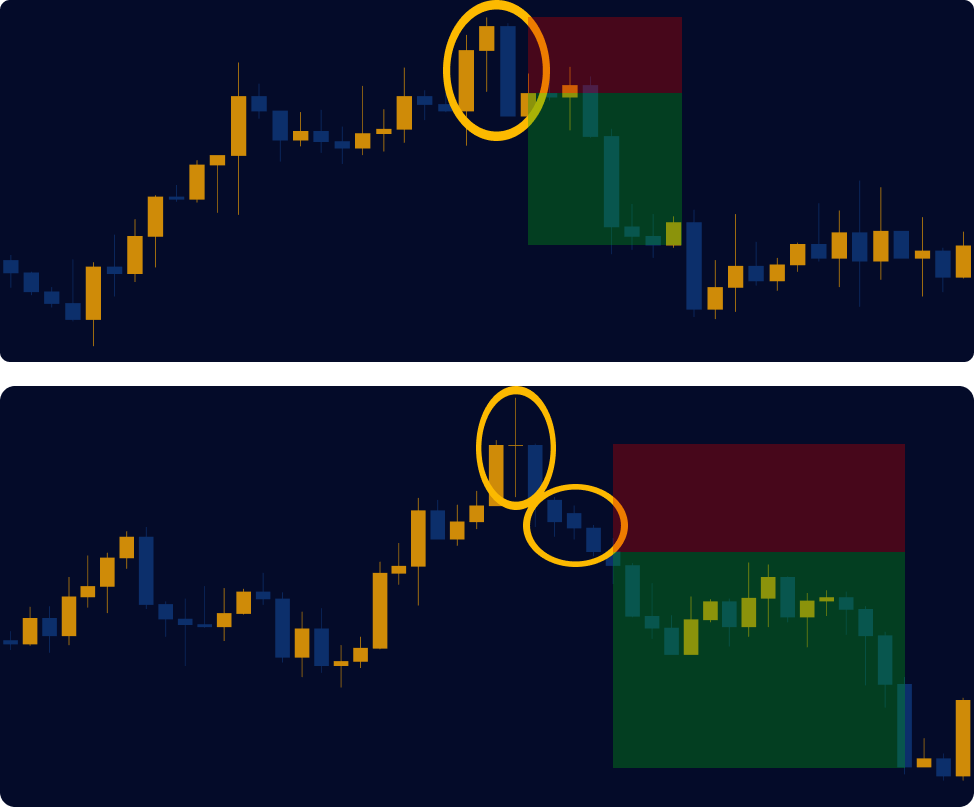
Candlestick patterns can give you a good idea of where the price of an asset is headed. Here’s how you can use candlestick patterns to trade forex:
1. Identify the Candles
The first step is to identify the specific candlestick formation that is forming on the chart. There are many different patterns, including the bullish hammer, bearish shooting star, bullish engulfing pattern, bearish harami, and more.
2. Determine the Trend
Once you have identified the pattern, the next step is to determine the trend. Is the trend bullish or bearish? You can use a top-down analysis aspect inline with a fundamental market analysis or institutional trading data.
3. Confirm the Signal
It is important to confirm the signal provided by the candlestick pattern. You can do this by looking at other technical indicators, such as the moving average, the Fibonacci retracement levels or market seasons.
4. Place your Trade
It’s time to set your stop loss & take profit levels and open your position. With good risk-to-reward ratios and passive risk management, you are able to trade profitable over the long-term.


