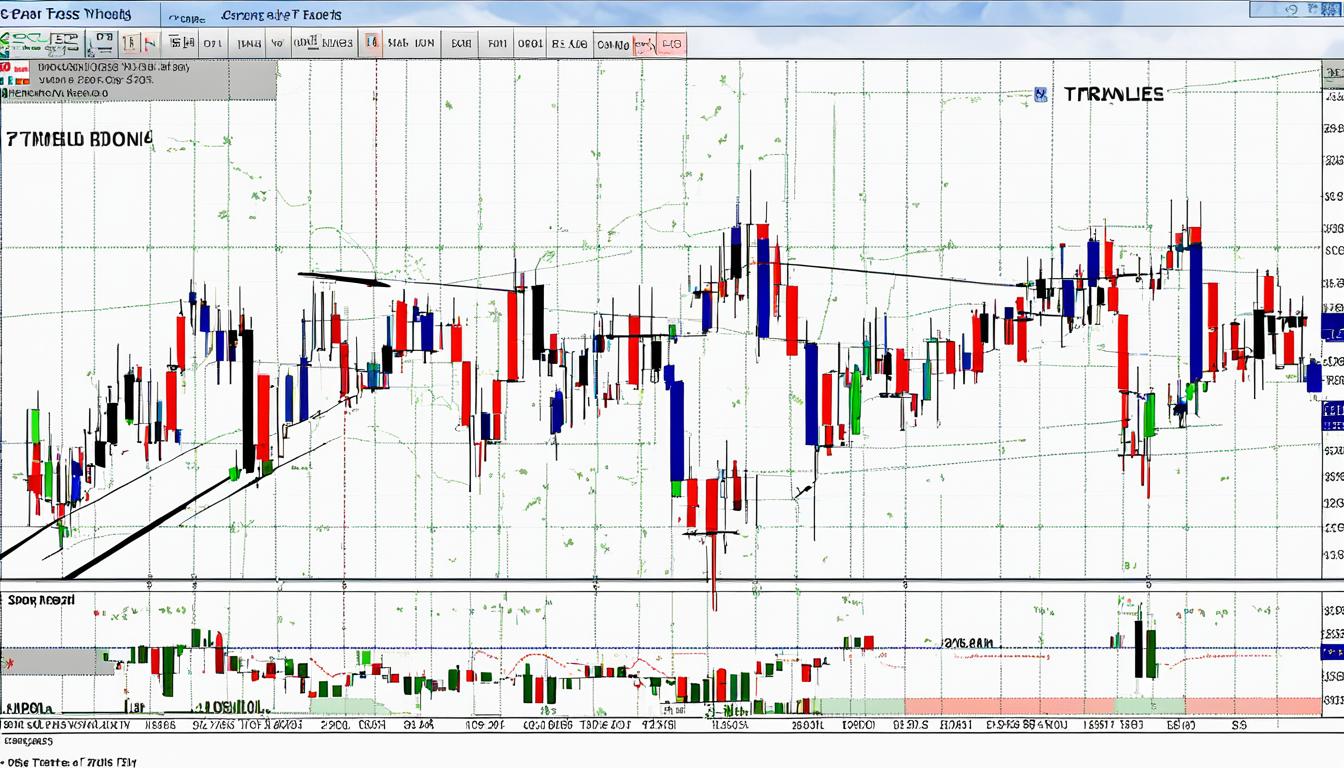
Among the meticulous practices in the financial realm, symmetrical triangle pattern trading stands out as a pivotal technique used by savvy traders. This method hinges on detecting the symmetrical triangle chart patterns, a formation that signals the potential for significant price movement, poised for a bullish or bearish breakout.
While maneuvering through the intricacies of symmetrical triangle forex trading, investors observe the contraction of prices within the confines of two converging trend lines. As the market consolidates its strength, the anticipation builds up among traders for an impetus that will catapult prices in a definitive direction.
Understanding the Basics of Symmetrical Triangle Pattern Trading
In financial markets, trendlines are more than mere lines on a chart; they are a reflection of market sentiment and a predictor of potential price movements. Among various chart patterns, the symmetrical triangle is particularly noteworthy for its ability to indicate consolidation and predict subsequent breakouts. This section delves into symmetrical triangle pattern analysis and discusses how this pattern can be incorporated into a robust symmetrical triangle trading strategy.
Definition and Characteristics of Symmetrical Triangles
A symmetrical triangle pattern emerges on a chart when the price of an asset swings within two converging trend lines. These trend lines are essentially the boundaries of lower highs and higher lows that the price action creates, resulting in a narrowing price range as the lines converge towards each other. This pattern is recognized by its distinct, symmetrical shape which symbolizes a balancing act between buying and selling forces before a significant price move.
Significance of Converging Trend Lines
The converging trend lines of a symmetrical triangle are pivotal in symmetrical triangle pattern analysis. They not only denote the consolidation phase but also serve as key levels to monitor for a break. Advanced traders often seek to understand how to spot symmetrical triangle patterns as these trend lines set the scene for an imminent and often powerful breakout, with the actual point of breakout being critical in determining the trade direction.
- Observation of Trend Lines: Traders watch for prices to bounce between these narrowing constraints, acting as a precursor to a potential breakout.
- Breakout Potential: The intersection of these trend lines is where traders anticipate market momentum to pick up, signaling them to prepare for entry.
- Establishment of Targets: Post-breakout, these trend lines help in setting price targets and stop-loss orders—an essential component of a successful trading strategy.
Comparison with Other Triangle Patterns
Unlike its counterparts—the ascending and descending triangles—which predict bullish and bearish breakouts, respectively, due to their horizontal bottom or top trend lines, the symmetrical triangle is regarded as a neutral pattern. Its breakout direction remains uncertain until confirmed. Traders must recognize this distinction to avoid bias and to maintain objectivity in pattern analysis. Spotting and interpreting these patterns accurately is key to capitalizing on the trading opportunities they present.
| Pattern | Trend Lines | Breakout Direction | Volume Confirmation |
|---|---|---|---|
| Symmetrical Triangle | Converging | Uncertain until confirmed | Important |
| Ascending Triangle | Flat top, ascending bottom | Bullish | Preferable |
| Descending Triangle | Flat bottom, descending top | Bearish | Preferable |
The essence of successful symmetrical triangle trading strategy lies in disciplined analysis, patient observation of trend lines, and an unbiased approach towards pattern validation. Effectively distinguishing between symmetrical triangles and other pattern types lays a solid foundation for executing well-informed trades.
Analyzing Symmetrical Triangles in Market Charts
Trading symmetrical triangles is a sophisticated approach within technical analysis that requires meticulous observation and timing. The importance of discerning the symmetrical triangle breakout strategy cannot be understated due to its implications for profitability and risk management. This strategy hinges on identifying the convergence of price moves forming a coherent triangle that forecasts potential breakout points.
Investors and traders search for the pivotal moment when the price action completes its coiling stage and is primed to make a definitive move. This usually takes place between the midway point and the final quarter of the triangle’s formative phase. It is this specific area within the triangle’s tightening price range where one can anticipate a significant shift, signaling either a continuation or reversal of the existing trend.
To ensure a level of certainty when engaging with trading symmetrical triangles, individuals monitor not only the price action but also the accompanying volume. An increase in trading volume provides a degree of confirmation that the breakout is authentic and that there is considerable market momentum behind the movement.
| Pattern Development Stage | Expected Volume Trend | Breakout Confirmation |
|---|---|---|
| Formation of Symmetrical Triangle | Limited and Decreasing | Not Yet Confirmed |
| Approaching Convergence Point | Stable With Anticipated Increase | Possible Upon Volume Surge |
| Post-Breakout | Significantly Increased | Confirmed With Sustained Price Movement |
Accurate analysis and preparation are critical for capitalizing on symmetrical triangle patterns. Historical data and pattern duration are considered alongside volume indicators to time the market effectively. Patience is key, as premature speculations of the breakout direction can lead to false starts and suboptimal positions. Ultimately, successful trading of symmetrical triangles involves waiting for clear signals and confirming the breakout before executing trades.
Executing the Symmetrical Triangle Trading Strategy
With the dynamic development of symmetrical triangle pattern trading, it’s critical for traders to be adept at executing trades based on the symmetrical triangle breakout strategy. Not only is the visual identification of these patterns important, but so is the precise timing of entries and exits, along with a clear understanding of potential price targets.
Determining Entry Points Within the Pattern
Patience is a virtue in symmetrical triangle pattern entry, where traders are advised to wait for a clear breakout supported by a significant increase in volume. This ensures the distinction between a false breakout and a solid move with the chance for sustained momentum. To execute trades with confidence, the entry should be made once this volume-backed breakout is evidently above or below the converging lines of the triangle pattern.
Setting Strategic Stop-Loss Levels
Strategic stop-loss orders are a trader’s best defense against unexpected market reversals. In the context of a symmetrical triangle pattern trading, setting a stop loss just below the breakout level can shield the trader from potential downside, minimizing losses if the breakout does not proceed as anticipated. This safety net is key to maintaining disciplined trading and preserving capital for future opportunities.
Identifying Target Price Projections
The decent conclusion of a successful entry in symmetrical triangle pattern trading is the determination of realistic price targets. These are identified by measuring the height of the base of the triangle and projecting it from the breakout point, either upwards or downwards, depending on the direction of the breakout. This quantifiable goal enables traders to set an objective exit point, thereby capturing profits before any potential reversal in trend occurs.
Symmetrical Triangle Breakout Strategy: Timing and Confirmation
The confluence of timing and confirmation forms the cornerstone of the symmetrical triangle breakout strategy, leading to effective decision-making in symmetrical triangle pattern trading. This decisive approach hinges on gauging the market’s nuances at critical junctures, typically at two-thirds of the pattern’s formation, where volume tends to taper, hinting at the impending volatility and the opportunity for a breakout.
Optimal Timeframes for Effective Breakouts
Identifying the optimal timeframe for a breakout within the symmetrical triangle pattern analysis is pivotal. As a rule of thumb, breakouts are most reliable when they occur near the completion of the pattern formation, suggesting a market that’s coiled and ready to unleash directional momentum. The patience to wait for this maturation stage, rather than rushing into trades, can drastically improve the efficacy of the strategy.
Volume and Price Confirmations as Indicators
For a breakout to stand scrutiny, it must carry the weight of volume and price confirmations. A genuine symmetrical triangle breakout strategy looks for an uptick in trading volumes to accompany the price breach of the trend lines. These confirmations serve as robust indicators, fortifying the trader’s position against market noise and providing assurance for the impending move.
The Role of False Breakouts in Strategy Planning
Navigating the symmetrical triangle pattern trading landscape involves an awareness of false breakouts. As these are inherent parts of market behavior, they serve as a critical checkpoint for strategy reassessment. A trader’s acumen is reflected in their ability to detect these deceiving moves, recalibrate their entry points, and manage risks, ensuring a tactical approach to the volatility of markets.
FAQ
What is a symmetrical triangle pattern in trading?
A symmetrical triangle pattern is a type of chart pattern recognized in technical analysis where the price action of a security is characterized by converging trend lines connecting a series of sequential peaks and troughs. These trend lines converge at an approximate angle, thereby creating a triangle. This pattern indicates a period of consolidation before a potential breakout or breakdown occurs, suggesting the continuation or reversal of the current trend.
What are the key principles of trading symmetrical triangles?
Key principles of trading symmetrical triangles include careful analysis of the pattern formation, waiting for a clear breakout with significant volume as confirmation, setting stop-loss orders to manage risk, and determining profit targets by projecting the height of the triangle onto the breakout point.
How do you determine entry points within a symmetrical triangle pattern?
Entry points within a symmetrical triangle pattern are generally determined after a clear breakout has occurred. Traders wait for price movement outside the converging trend lines on higher-than-average volume as confirmation before taking a position. The exact entry point can vary based on individual strategy and risk tolerance.
How are target price projections identified for symmetrical triangle patterns?
Target price projections for symmetrical triangle patterns are identified by measuring the distance from the highest peak to the lowest trough within the pattern (at its widest part) and then applying that measurement from the breakout point in the direction of the breakout. This method offers a quantitative objective for the expected price move.
What constitutes optimal timing for trading breakouts in symmetrical triangle patterns?
Optimal timing for trading breakouts in symmetrical triangle patterns is often when the price action has reached somewhere between 50% to 75% of the way through the pattern. This is when a breakout is most likely to occur and is ideally accompanied by a corresponding increase in volume to confirm the breakout’s validity.
What role do false breakouts play in symmetrical triangle strategy planning?
False breakouts play a significant role in strategy planning as they represent potential traps for traders. They occur when the price moves outside of the triangle pattern but fails to continue in the direction of the breakout, quickly reversing back into the pattern. This can lead to premature entries and losses. Traders must consider the possibility of false breakouts and employ confirmation techniques, such as waiting for a price close outside the trend lines and increased volume, to mitigate the associated risks.


