The world of stock trading is ever-evolving, continually offering traders new strategies and indicators to maximize their profit potential. One such noteworthy tool is the TRIN Ratio, also known as the Arms Index. This article aims to give you a comprehensive understanding of the TRIN Ratio, including its calculation, applications, and how it sets itself apart from other indicators, like MACD.
What is the TRIN Ratio?
The TRIN Ratio, short for Trading Index, is a volatility indicator that compares advancing and declining stocks to their respective volumes. Developed by Richard Arms in 1967, the TRIN Ratio aims to measure market sentiment by evaluating the relationship between the number of stocks rising against those falling. Richard Arms also published the book “The Arms Index Trin“.
How to Calculate the TRIN Ratio?
The calculation of the TRIN Ratio involves a few steps but is straightforward. Here's how:
- Calculate the Advance-Decline Ratio: Divide the number of advancing stocks by the number of declining stocks.
- Calculate the Advance-Decline Volume Ratio: Divide the total volume of advancing stocks by the total volume of declining stocks.
- Finally, calculate the TRIN Ratio: Divide the Advance-Decline Ratio by the Advance-Decline Volume Ratio.
This can be summarized as:
TRIN = (Advancing Stocks/Declining Stocks) / (Advancing Volume/Declining Volume)
Interpreting the TRIN Ratio
The TRIN Ratio is an oscillator, with a value typically oscillating around 1. A TRIN Ratio less than 1 indicates bullish market sentiment, as the volume of advancing stocks is higher than declining ones. Conversely, a TRIN Ratio greater than 1 signifies bearish market sentiment, pointing to a higher volume of declining stocks.
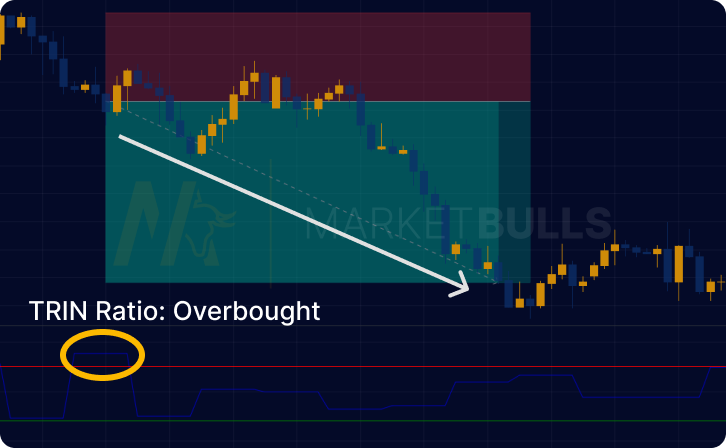
However, the TRIN Ratio's nuances lie in its extremes. Values significantly below 1 or above 3 can signal overbought or oversold market conditions, respectively, hinting at a potential market reversal.
Trading with the TRIN Ratio: A Step-by-Step Guide
Trading with the TRIN Ratio is a method that experienced traders often use to interpret market breadth and forecast potential shifts in market sentiment. Here's a step-by-step guide to help you understand how to use this powerful tool:
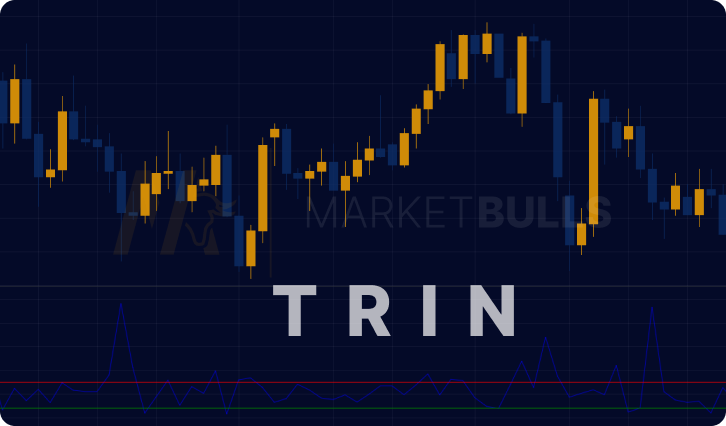
Setting up the TRIN Ratio: Before you begin, you will need to set up the TRIN Ratio on your trading platform. Most platforms offer this feature in their list of indicators. After selecting the TRIN Ratio, you will see a line graph that oscillates around the value of 1.
Interpreting the TRIN Ratio Values: Remember, a TRIN value below 1 signifies bullish market sentiment, as the volume of advancing stocks is higher than declining ones. A TRIN Ratio above 1 indicates bearish sentiment with a larger volume of declining stocks.
Identifying Overbought and Oversold Conditions: Pay close attention to extreme TRIN values. A TRIN Ratio significantly below 1 or above 3 might suggest overbought or oversold market conditions respectively, signaling a possible market reversal.
Confirming with Other Indicators: It's essential to confirm the signals provided by the TRIN Ratio with other indicators. For example, if the TRIN Ratio indicates an overbought market condition, you can confirm this with other momentum indicators such as the RSI or MACD.
Setting Entry and Exit Points: Once you have confirmed the market condition, it's time to set your entry and exit points. For instance, if the market is overbought, you may want to consider selling your position and waiting for a more favorable time to enter.
Regular Monitoring: Keep a close eye on the TRIN Ratio throughout your trading day. Changes in the TRIN Ratio can provide valuable insights into shifts in market sentiment, allowing you to adjust your strategy accordingly.

Remember, while the TRIN Ratio is a powerful tool, it's not foolproof. It's crucial to use it in conjunction with other trading strategies and indicators, and to consider the broader market context before making trading decisions.
Comparing the TRIN Ratio with Other Indicators
While the TRIN Ratio and other indicators like the Relative Strength Index (RSI) or Moving Average Convergence Divergence (MACD) are oscillators, they serve different purposes. While RSI and MACD are primarily momentum indicators, the TRIN Ratio is a breadth indicator, measuring the internal strength or weakness of the market.
Conclusion
Understanding the TRIN Ratio, from its calculation to its application in trading, can significantly enhance your trading arsenal. Whether used in isolation or in tandem with other technical indicators, the TRIN Ratio offers traders an edge in navigating the financial markets' turbulent waves.
FAQs
The TRIN Ratio, also known as the Arms Index, is a volatility indicator that compares advancing and declining stocks to their respective volumes.
The TRIN Ratio is calculated by dividing the number of advancing stocks by the number of declining stocks, and dividing the result by the advancing volume divided by the declining volume.
A TRIN Ratio below 1 signifies bullish sentiment, while a TRIN Ratio above 1 signifies bearish sentiment. A TRIN Ratio of 1 indicates a balanced market.
Yes, the TRIN Ratio is a contrarian indicator. High readings suggest an oversold market and predict a bullish reversal, while low readings suggest an overbought market and predict a bearish reversal.
Yes, while initially designed for the NYSE, the TRIN Ratio is now used across various markets, including the NASDAQ.


