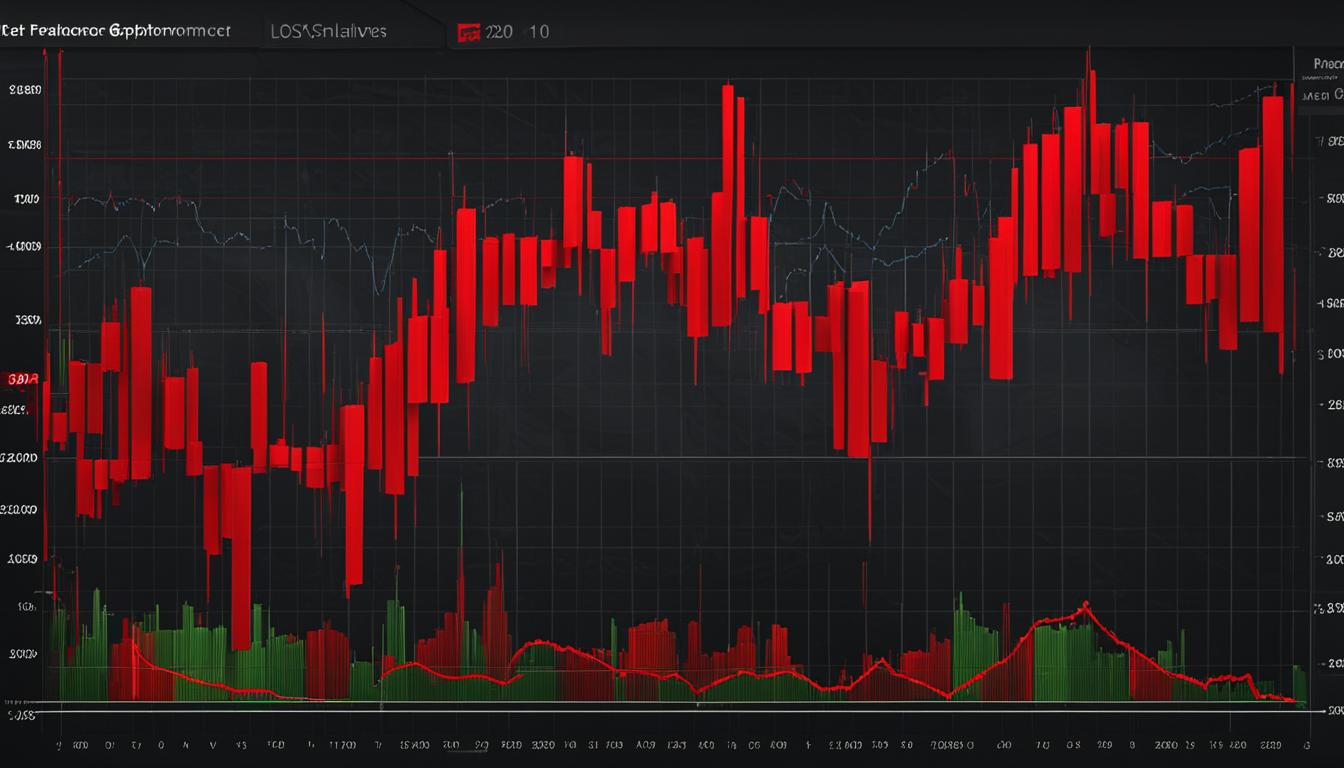
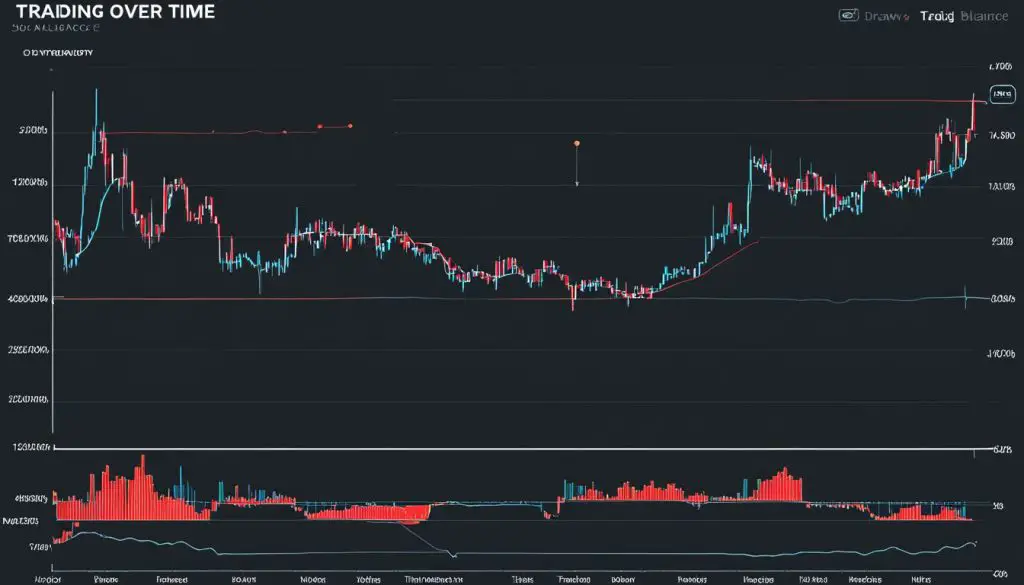
Within the dynamic realm of the financial markets, the term ‘drawdown’ plays a critical role in both gauging investment success and understanding the resilience required to navigate market volatility. Essentially, drawdown in finance refers to the evaluation of risk by measuring the ebb and flow of asset values over time.
But, what is drawdown in trading, and why should investors care about it? In essence, the drawdown definition hinges on identifying the reduction from an investment’s peak to its lowest point, before mounting a recovery. This metric provides transparent insight into the nature of drawdown meaning: the potential financial setback one might endure within a portfolio. It stands as a stark reminder that financial markets are a landscape of highs and lows, challenging traders to maintain a steady course through the peaks and troughs.
As we peel back the layers of financial jargon, it’s clear that understanding drawdowns is not merely academic. These figures cast light on the depths of past downturns, offering a historically grounded perspective on the volatility investors may face. As such, the knowledge of drawdowns is indispensable in the arsenal of any seasoned trader or investor. It aids in sculpting strategies that are resilient in the face of adversity, underscoring the importance of robust risk management practices.
Important Readings on Drawdown:
- Max. Drawdown
- Trailing Drawdown
- Max. Trailing Drawdown
- Relative Drawdown
- Drawdown in Bonds
- Reduce Drawdown
Defining Drawdown in the Context of Trading
Grasping the concept of drawdown within the arena of trading is paramount for both new and seasoned investors. Understanding drawdown in trading helps in comprehending the ebb and flow of portfolio values over time. Simply put, a drawdown refers to the dip in investment value from its highest peak to a subsequent low, offering a tangible sense of the investment’s volatility and risk.
A powerful component of a robust drawdown strategy is the ability to put these metrics in perspective. For instance, during an active trading phase or throughout a financial quarter, the consistency and magnitude of drawdowns can paint a vivid picture of an investment’s resilience or fragility under market stress. When measuring drawdown in trading, a key consideration is not just the percentage decline, but also the duration and the recovery path of the asset concerned.
- Monitoring Performance: Drawdowns are indicative of past performance and can be a gauge for potential future dips.
- Strategic Adjustments: Frequent or deep drawdowns might signal the need for a strategy reassessment or risk reevaluation.
- Risk Management: By understanding the typical drawdown range for an investment, traders can set more informed stop-loss orders.
Particularly noteworthy is the impact on retirees or long-term investors. Substantial drawdowns can significantly reduce the longevity of a retirement fund, especially if they coincide with scheduled withdrawals. Thus, integrating drawdown measures into the broader analysis helps in sculpting a more resilient investment approach, potentially tilting the scales towards holdings with a history of smaller or less frequent drawdowns.
One of the methods involved in calculating the risk-to-reward balances is by employing metrics such as the Sterling ratio. This particular metric takes into account the average annual return and divides it by the average negative drawdown, minus a 10% threshold. It serves as a litmus test for the performance of funds and portfolios, especially when benchmarked against peers or market indices.
In conclusion, mastering the dynamics of drawdown is essential for any investor seeking to refine their trading strategy and ensure the longevity of their portfolio’s health. It is a key barometer of investment performance and a vital risk assessment tool, crucial for making well-informed financial decisions in the ever-changing tapestry of the trading world.
How to Calculate Drawdown in Your Trading Account
Mastering the concept of drawdown calculation is essential for any trader aiming to manage drawdown risk effectively. This process involves pinpointing the highest value your account has reached and determining the largest percentage decrease from that peak to the lowest point before a rebound. Appreciating this figure is crucial as it speaks volumes about the trading account drawdown and the resilience needed to recover from such dips.
The Formula for Drawdown Calculation
The universal approach to calculating a drawdown requires a simple mathematical formula. Let’s delineate this straightforward process:
- Identify the peak account value before the drawdown.
- Note the lowest value of your account following the peak.
- Subtract the low point from the peak to find the amount lost.
- Divide the lost amount by the peak value.
- Multiply by 100 to convert to a percentage.
This method yields the drawdown percentage, a figure that is pivotal in evaluating investment performance and potential drawdown risk attached to your trading strategy.
Analyzing Drawdown Through Real-World Examples
Illustrating drawdown through real-life scenarios assists in grasping its impact. For example, consider a scenario where a trading account spirals from a high of $10,000 to a low of $9,000 before it embarks on a recovery journey. This $1,000 dip translates to a 10% drawdown, offering a quantifiable glimpse into the trader’s risk exposure. Such examples underscore the importance of a drawdown calculator and managing drawdowns to safeguard against compounded potential losses, particularly during volatile trading periods.
Effective risk management strategies often hinge on ensuring drawdowns remain within tolerable levels. While occasional dips are part and parcel of the trading landscape, continuous monitoring and calculated reactions to drawdowns can shield your investment from severe downturns.
Understanding the Impact of Drawdown on Your Portfolio
When managing a trading portfolio, one of the most critical challenges faced by investors is the drawdown impact. Significant drawdowns do not merely reflect temporary setbacks; they accentuate the underlying drawdown risk associated with investing. For instance, recovering from a drawdown requires a return on investment that is disproportionately higher than the percentage lost. A nuanced understanding of drawdown dynamics can thus substantially augment effective portfolio management strategies.
Assessing the severity of potential drawdowns is crucial in planning for both the protection and the recovery of your investments. Below is a table illustrating the required recovery percentage following different levels of drawdown:
| Drawdown Percentage | Required Recovery |
|---|---|
| 10% | 11.1% |
| 20% | 25% |
| 30% | 42.9% |
| 40% | 66.7% |
| 50% | 100% |
As the table reveals, minor drawdowns require comparably modest recovery efforts. However, as drawdown deepens, the recovery percentage needed grows exponentially, underlining the significance of mitigating risks and employing diversification as a hedge against steep declines. Especially for retirees who require the liquidity of their assets, the imperative of portfolio resilience against drawdown becomes ever more pressing.
- Review investment strategies regularly to minimize drawdown risk.
- Employ diversification to reduce the drawdown impact on the portfolio.
- Balance risk with performance goals for optimal portfolio management.
Diligent management of drawdown is an essential component of a balanced, reactive investment strategy that can safeguard against potential losses and facilitate more predictable long-term growth for investors.
Comparing Drawdown to Other Risk Metrics
Investors prioritize understanding various risk metrics to navigate market complexities effectively. Among these vital measures, drawdown stands out due to its focus on the magnitude of loss from an asset’s peak performance. This valuable indicator complements other metrics, enriching market analysis and providing depth to risk management strategies. By examining drawdown in conjunction with volatility and standard deviation, investors can gain a multi-faceted view of the financial landscape and secure their portfolios against potential downturns.
The Relationship Between Drawdown and Volatility
Drawdown and volatility are inherently linked, serving as key indicators of investment risk. The distinct advantage of drawdown lies in its ability to capture the severity of a loss from a historical peak, contrasting to the general price movement represented by volatility. While volatility sketches a broader picture of price variation, drawdown narrows the focus, offering insights into the gravest drops an asset has experienced. This differentiation is critical for investors looking to comprehend the maximum negative swing of their investments.
Drawdown Versus Standard Deviation in Market Analysis
While standard deviation is a mainstay in market risk analysis, detailing overall volatility, drawdown provides a precision cut of the potential losses. Unlike standard deviation, which reflects the total distribution of returns around the mean, drawdown zeroes in on the most extreme declines, presenting a stark illustration of what the bottom line could look like during adverse market conditions. The sharp contrast between these metrics empowers traders and investors to tailor their risk assessments and strategize accordingly, aiming for a balanced approach that suits their risk tolerance and the ongoing market pulse.
FAQ
In trading, drawdown refers to the reduction from a peak in the value of an investment or trading account to a subsequent trough. It is an important measure of downside risk and potential financial exposure in finance, assessing the equity loss in an investment or trading strategy over a certain period. A drawdown is not necessarily indicative of a loss, as it may recover, but it shows the fluctuation in value from its highest point to its lowest before potentially moving back up.
Drawdown in finance is distinct from other types of financial losses as it primarily concentrates on the decline from an investment’s peak value to its lowest point before recovery, not necessarily compared to the entry point or purchase price. In contrast, a financial loss is usually defined as the difference between the purchase price and the current or exit price, reflecting negative performance without necessarily referencing the historical peak.
Understanding drawdown is critical for trading and portfolio management because it helps investors gauge the risk and volatility of their investments. It indicates the potential downside risk and financial exposure an investor might face during periods of market dips. Additionally, understanding drawdown can inform risk management decisions, help devise drawdown strategies to protect the capital, and allow for better comparison between different investments or funds based on their historical performance.
To calculate the drawdown in a trading account, you must identify the highest value your account has reached (the peak) and measure the percentage decrease from that peak to the lowest point (the trough) that follows before the account value recovers back to the peak value. This is done through a formula that involves determining the peak value and subtracting the trough value, then dividing by the peak value, and finally converting that figure into a percentage.
The main difference between drawdown and standard deviation in the context of market risk analysis lies in their focus and calculation. Standard deviation measures the total volatility – how much an investment’s returns can deviate from its average return, taking into account both upward and downward movements. On the other hand, drawdown focuses on the magnitude of loss exclusively and measures the decline from an investment’s peak to its subsequent lowest point before recovery.


