In the volatile realm of trading, keeping a keen eye on market fluctuations is crucial. Enter the Average True Range (ATR) – a technical analysis indicator designed to quantify market volatility. Crafted by J. Welles Wilder Jr., who also introduced us to the iconic Relative Strength Index (RSI) and the Parabolic SAR, the ATR acts as a cornerstone of sound trading strategy. In this article, we deep-dive into the workings, interpretation, and utility of the Average True Range Indicator. So strap in and get ready for a knowledge-rich journey.
Understanding the Average True Range Indicator
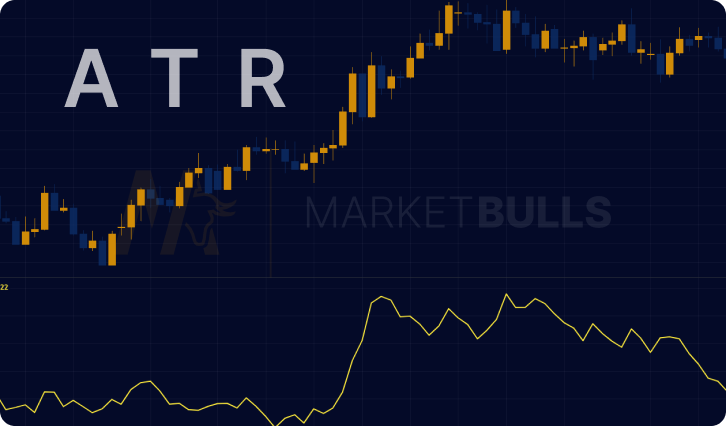
Unlike some of its counterparts, the Average True Range Indicator doesn't provide information about the direction of price movements. Its role lies elsewhere – it's a beacon, shining a light on the degree of price volatility. By decoding market volatility, the ATR helps traders to navigate the choppy waters of trading more effectively, preparing them for the market's potential rough seas.
Calculation of the ATR
Unearthing the secrets of the ATR begins with understanding its calculation. It's a process which involves a few stages. Initially, the True Range of each period is calculated, deemed the greatest of these three measures:
- The current High subtracted from the current Low
- The current High subtracted from the previous Close
- The current Low subtracted from the previous Close
After the True Range is obtained, we then move to calculate the ATR, which is typically the 14-period moving average of these True Range values.
Trading with ATR: A Strategic Approach
While the ATR serves as a valuable tool for setting stop loss levels, it also holds significant sway when it comes to timing entries and exits in trading scenarios.
Setting Stop Loss with ATR: An ATR-Based Strategy
A frequently used ATR trading strategy revolves around setting stop loss levels. Traders often establish their stop loss at a multiple of the current ATR value. This multiplier varies, but as an example, a trader might define the stop loss at two times the current ATR reading, providing a buffer against undesirable price fluctuations.
Timing Entries and Exits with ATR: Making Moves with Volatility
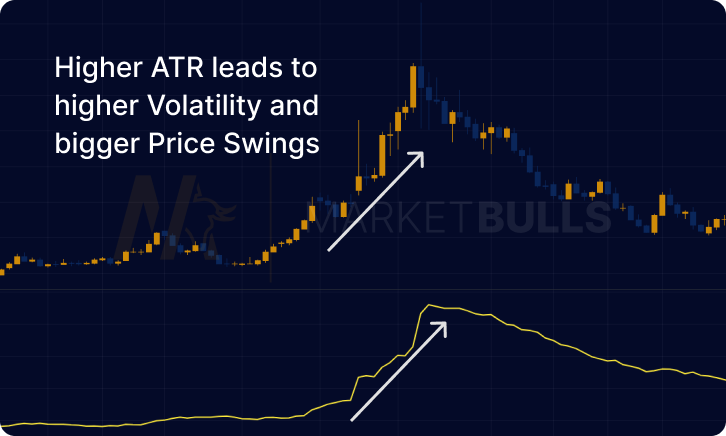
Some traders rely on ATR to time their entries and exits in the market. When the ATR experiences an uptick, it's an indication of rising volatility, potentially marking the dawn of a new trend. Conversely, a downtrend in the ATR could serve as a red flag that the current trend is nearing its end.
The ATR in Forex Trading: Managing Market Volatility
The ATR has emerged as an indispensable asset in Forex trading. Forex traders find the volatility insights provided by the ATR invaluable, particularly in a market that never sleeps. Higher ATR values signal high volatility, thus indicating larger potential for both profits and losses.
The Role of the ATR in Crypto Trading
As in forex, the ATR serves as a critical instrument for traders in the crypto market. Known for its extreme volatility, understanding and adapting to the market's erratic nature is paramount for success in crypto trading – a task the ATR is cut out for.
The ATR Indicator Formula: Unpacking the Calculation
The formula for calculating the ATR is as follows:
ATR = (1/n) * ∑TR
In this equation:
- n represents the number of periods
- TR stands for the True Range
While seemingly simple, this formula carries significant weight, providing traders with insights into market volatility and potential price movements.
Trading with the ATR: A Step-by-Step Guide
The Average True Range (ATR) is a robust tool that provides valuable insights into market volatility. Here is a step-by-step guide on how to trade using the ATR:
Understand What ATR Indicates: The ATR measures market volatility but does not indicate market direction. A higher ATR typically suggests a more volatile market, which can mean larger price fluctuations. A lower ATR represents a less volatile market.
Determine Your ATR Period: The ATR period is the number of bars, or periods, used in the ATR calculation. The default setting is typically 14 periods, but you can adjust it based on your trading style and strategy.
Identify the ATR Reading: The ATR value is usually denoted in price units on the chart. For instance, an ATR reading of 0.0040 on a forex chart means that the asset moved an average of 40 pips over the specified period.
Apply the ATR to Your Trading Strategy: You can use the ATR in various ways, such as setting stop loss levels and timing entries and exits. For stop loss placement, a common strategy is to set the stop loss at a multiple of the current ATR value.
Monitor and Adjust as Necessary: Like any trading strategy, using the ATR isn't a guaranteed path to profits. It's vital to continuously monitor your trades and adjust your strategy based on market conditions and your risk tolerance.

Limitations of the Average True Range Indicator
While the Average True Range (ATR) is an invaluable tool in any trader's arsenal, it's crucial to remember that it has its limitations. Here are some potential constraints when employing the ATR in your trading strategy:
No Directional Indication: The ATR is focused solely on measuring volatility and does not provide insights into the direction of price movements. Traders often need to complement ATR analysis with other indicators to infer the price trend.
Susceptibility to Abrupt Market Shifts: Sudden, extreme price changes, such as those occurring around significant news events, can cause distortion in the ATR. These abrupt shifts may result in inflated ATR values, which might not be indicative of a sustained increase in volatility.
Ineffectiveness in Low Volatility Conditions: During low-volatility periods, the ATR may generate low readings that offer little valuable information to traders. In such scenarios, the utility of the ATR might be restricted.
Need for Supplementary Confirmation: The ATR, like most indicators, should not serve as the sole basis for making trading decisions. Incorporating other analysis methods, like chart patterns, price action, or additional technical indicators, is crucial to confirm the ATR's signals.
Period Dependency: The values derived from the ATR are contingent on the chosen calculation period. Different time frames can yield varying results, which may not always be consistent with your trading strategy. Therefore, it's vital to experiment with different periods and adjust them based on your trading approach and risk tolerance.
Recognizing these limitations can enable traders to use the ATR more effectively, enhancing their trading strategy while mitigating potential missteps. A successful trading strategy typically incorporates multiple indicators, sound risk management, and a comprehensive understanding of the market environment with cot report.
Conclusion
With its ability to measure market volatility, the Average True Range Indicator is a powerful tool in a trader's toolkit. Whether trading stocks, forex, or cryptocurrencies, the insights provided by understanding and using the ATR can be a game-changer, providing a significant edge in the market.
FAQs
The Average True Range (ATR) is an indicator that measures market volatility. It quantifies the degree of price variation, helping traders anticipate possible price changes.
The ATR is computed by first calculating the True Range for each period. The ATR is then the 14-period moving average of these True Range values.
Common strategies involve setting stop loss levels based on the ATR or using it to time market entries and exits.
In forex trading, ATR is used to understand market volatility. Higher ATR values indicate higher volatility and vice versa.
The ATR provides insights into crypto market volatility, assisting traders in making informed decisions based on expected price fluctuations.
The ATR is calculated using the formula: ATR = (1/n) * ∑TR, where n is the number of periods, and TR is the True Range.
Trading with ATR involves understanding its indications, determining your ATR period, identifying the ATR reading, applying it to your trading strategy, and consistently monitoring and adjusting as necessary.


