Discover the ins and outs of the OBV trading world. Immerse yourself in OBV divergence, wield the power of the OBV indicator strategy, and grasp the On Balance Volume formula for impactful trading decisions.
Delving into the On Balance Volume Strategy
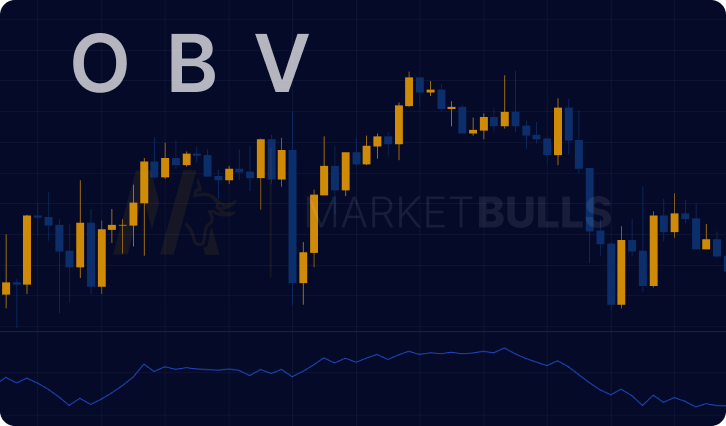
The On Balance Volume (OBV) strategy is an integral technical analysis tool that empowers traders to interpret market trends. This volume-based indicator places cumulative trading volumes under the microscope to predict price shifts. In the trading arena, OBV serves as a unique edge in navigating the market's ebb and flow. It can be perfectly used in conjunction with candlestick patterns.
Unpacking the On Balance Volume Formula
The OBV relies on trading volume and price activity to come up with a value. The guiding principle is simple: when the closing price exceeds the previous day's close, the volume for the day is added to the OBV. When it's lower, the volume is subtracted. If prices remain steady, the OBV stays unchanged.
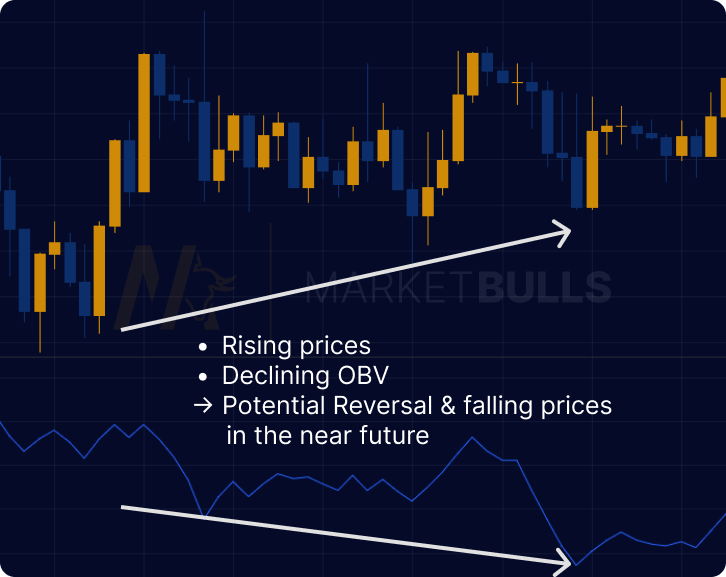
This rudimentary formula, despite its simplicity, is a gateway to powerful market insights, showing the direction of 'smart money'. A critical component to look out for is the OBV divergence, which happens when OBV trends counter to price trends, indicating potential market reversals.
Now, let's unravel how to apply the on balance volume formula to trading strategies effectively.
Crafting Your OBV Trading Strategy: A Step-by-Step Guide
Here's a list of steps to create an effective OBV trading strategy:
- Identify OBV Divergence: Look for divergences between OBV and price trends. For example, if prices are rising while OBV is falling, it could signal that the upward trend lacks volume support and might reverse soon.
- Use Additional Indicators: Always employ other technical indicators and market analysis to validate your insights. Never rely solely on a single indicator. A good combination can be the PSAR indicator.
- Follow the Trend: OBV can confirm if a trend is backed by volume, boosting your confidence in your trading decisions. Remember the golden rule: "Trade with the trend."

Harnessing the Power of OBV Indicator Strategy
The OBV indicator strategy bolsters the effectiveness of volume analysis by helping traders pinpoint key market trends and reversals. It's a crucial guide for well-informed trading decisions.
A common OBV strategy involves monitoring the OBV trend in relation to the price trend. When there's an OBV divergence, it might serve as an early signal of a potential price reversal. Remember, though, the OBV indicator strategy isn't a standalone solution. It should be paired with other technical tools for a well-rounded market analysis.
Conclusion
The On Balance Volume strategy gives traders a panoramic view of the market's inner workings. It offers precious insights into potential market trends and shifts, making it more than a tool — it's an asset to every trader's toolkit. Successful trading, however, demands a harmonious blend of multiple tools and techniques.
FAQ
The On Balance Volume (OBV) strategy is a technical analysis tool that combines volume and price to anticipate market trends.
OBV is computed by adding the day’s volume to a cumulative total when the security’s price closes up, and subtracting the volume when it closes down.
OBV divergence happens when the OBV trend contradicts the price trend. This could be a potential warning sign of a price reversal.
Although the OBV trading strategy provides valuable insights, it’s most effective when coupled with other technical analysis tools and market insights.


