Are you seeking a tool to underline your trading with institutional data like COT or seasonals? Welcome to the VWMA Indicator, a magic wand in your trading arsenal. This article is your go-to guide to understanding, interpreting, and utilizing this powerful tool.
Grasping the Concept of VWMA Indicator
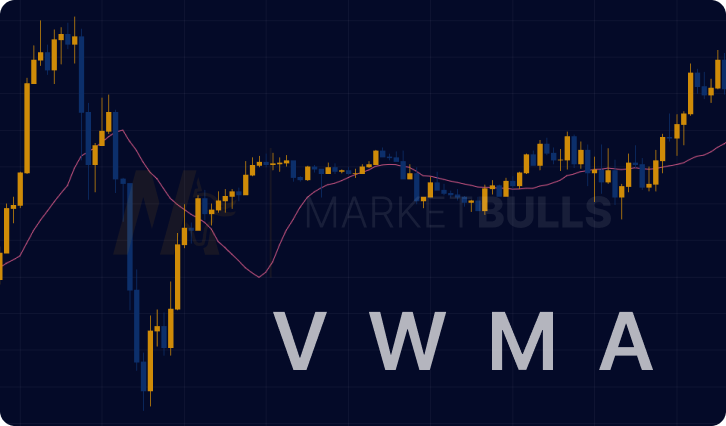
The Volume Weighted Moving Average (VWMA) indicator is a trading tool that attaches greater weight to price points with higher trading volume. This makes it an accurate mirror of market sentiment. But what gives it a trader's best friend status? The answer lies in its ability to provide a realistic picture of market dynamics.
Leveraging the VWMA Indicator to Your Advantage
The Volume Weighted Moving Average Indicator is not just about crunching numbers; it's about understanding the story behind these numbers. A price rise backed by high trading volume is indicative of strong investor sentiment. Recognizing these trends and acting on them could make the difference between a savvy investment and a missed opportunity.
Calculating the VWMA Indicator: A Step-By-Step Guide
VWMA is calculated using the following formula:
VWMA = (Closing Price * Volume) / Volume
This formula assigns more weight to the days with more volume. The higher the volume, the more the closing price of that day will influence the indicator.
Deciphering the VWMA Indicator: A Practical Guide
Interpreting the VWMA Indicator might seem daunting, but it doesn't have to be. Here's a comprehensive guide to demystify it.

Spotting Trends with VWMA Indicator
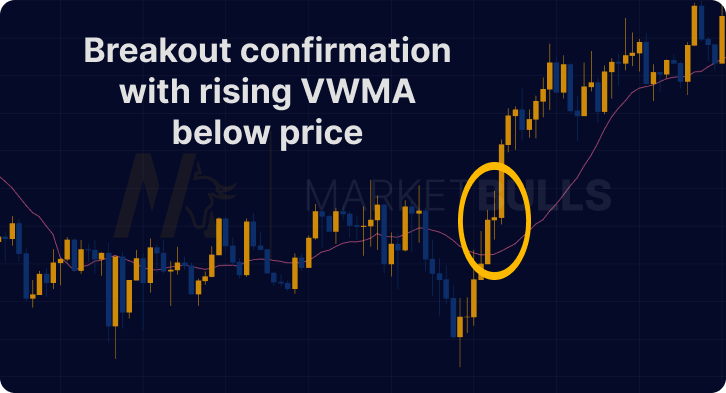
When the Volume Weighted Moving Average is above the price, it signals a bearish trend. Conversely, if it’s below the price, it’s a sign of a bullish trend.
Identifying Breakouts Using Volume Weighted MA
A sudden spike in the VWMA accompanying a price rise could suggest a possible breakout, hinting at strong trading activity.
Detecting Volume Confirmation with VWMA Indicator
When the VWMA crosses over a Simple Moving Average (SMA), it could indicate high-volume buying or selling, reinforcing the current trend.
Blending the Volume Weighted MA Indicator into Your Trading Strategy
Once you've understood the VWMA Indicator, the next step is to weave this knowledge into your trading strategy.
Utilizing VWMA Indicator in Bullish Scenarios
If you spot a price increase accompanied by a rising Volume Weighted Moving Average, it could be the ideal time to buy.
Utilizing VWMA Indicator in Bearish Scenarios
If the VWMA dips despite a rising price, it might signal a weakening trend, alerting you to potentially sell.
Potential Pitfalls and Misconceptions About VWMA Indicator
While VWMA can be a powerful tool, it’s not infallible. Traders should use it in conjunction with other indicators and not solely rely on it. It is also crucial to remember that Volume Weighted Moving Average is a lagging indicator, which means it reflects past prices, and while it can hint at future trends, it doesn't predict them.
VWMA vs. Other Trading Tools
Unlike Simple Moving Average (SMA) that assigns equal weight to all periods, Volume Weighted Moving Average assigns more weight to periods with higher trading volume, providing a more accurate picture of market sentiment.
Practical Tips for Incorporating the VWMA Indicator into a Trading Strategy
The VWMA Indicator can guide your market entry and exit points. A rising VWMA alongside a price increase could be a good entry point, while a falling VWMA with a rising price could suggest a potential exit point. Keep in mind to combine the indicator with other trading strategy, like Parabolic SAR.
Conclusion
The VWMA Indicator is more than just a tool; it's a guiding light in the complex world of trading. By understanding, interpreting, and leveraging its potential, you can sail smoothly on the volatile waves of trading.
FAQs
The VWMA Indicator is a moving average that assigns more weight to price points associated with higher trading volumes.
The VWMA Indicator provides a more realistic reflection of market sentiment, making it invaluable in discerning market trends.
The VWMA is above the price in a bearish trend and below the price in a bullish trend. A sudden spike in VWMA could hint at a potential breakout.
Yes, the VWMA Indicator can be applied across all asset types, including stocks, forex, commodities, and cryptocurrencies.
Unlike the SMA, the VWMA incorporates trading volume into its calculation, offering a more accurate picture of market dynamics.
The VWMA Indicator can guide your market entry and exit points. A rising VWMA alongside a price increase could be a good entry point, while a falling VWMA with a rising price could suggest a potential exit point.


