Dragonfly Doji Candlestick Pattern: The Bullish Reversal Secret!

Candlestick patterns are graphical depictions of price fluctuations over time. They are created by combining an asset’s open, close, high, and low prices and can give helpful information regarding market fluctuations. Candlestick trading patterns, like the Dragonfly Doji Candlestick Pattern, are employed in technical analysis to forecast future market movements and benefit both short-term and long-term traders.
Candlestick designs comprise two components: the body and the wick. The body reflects the opening and closing prices for that period, while the wick indicates the high and low prices. A lengthy wick implies that there was substantial price movement over that period, whereas a small wick shows that there was a limited price change.
Dragonfly Doji Candle Characteristics
The Dragonfly Doji is a bullish reversal candlestick pattern that appears at the end of a downtrend. It has a long lower wick, a small or non-existent upper wick, and a small or non-existent body. The long lower wick indicates that the price has reached its lowest point during that period. The buyers have taken control, pushing the price back up. The small or non-existent upper wick indicates little or no selling pressure during that period. The counter candlestick pattern is the bearish Gravestone Doji Pattern.
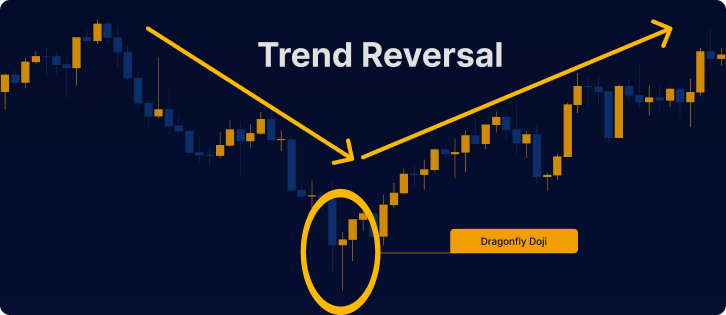
The Dragonfly Doji candlestick pattern is formed when the opening and closing prices are the same or very close. It is important to note that the pattern can also form with a small upper wick. But the long lower wick gives the pattern more strength.
Trading the Candlestick Pattern in Financial Markets
The Dragonfly Doji candlestick can be used in any financial market. Here are some general steps for trading the Dragonfly Doji in any market:
- Identify the pattern: Look for a candlestick with a long lower wick, a small or non-existent upper wick, and a small or non-existent body.
- Determine the context: The Dragonfly Doji pattern is a bullish reversal pattern that appears at the end of a downtrend. Make sure the pattern appears in the proper context before considering a trade.
- Wait for confirmation: It’s essential to wait for confirmation before entering a trade. Look for additional bullish signals. Such as an increase in trading volume, a break above resistance levels, or a confirmation from weekly COT Data.
- Set stop-loss orders: To minimize potential losses, set stop-loss orders. You can automatically exit the trade if the price moves against you.
- Take profits: If the price continues to move in a bullish direction, consider taking profits at predetermined levels. Traders can use technical indicators such as support and resistance levels, Fibonacci retracements, or trendlines to determine potential exit points.
- Practice risk management: Trading any financial market involves risks. Traders should always use risk management strategies such as limiting position sizes, diversifying their portfolio, and never investing more than they can afford to lose.
Following these general procedures, traders can earn from trading the Dragonfly Doji candle in any financial market. But keep in mind that no trading technique is perfect. Traders should always perform their respective analyses and due diligence before trading.
Examples of Dragonfly Doji in Cryptocurrency Markets
If you are an active cryptocurrency trader, you must be looking to up your knowledge about one of the most intriguing patterns, the Dragonfly Doji candle.
Let’s look at some examples of Dragonfly Doji patterns in cryptocurrency markets.
Example 1 – Bitcoin (BTC/USD)
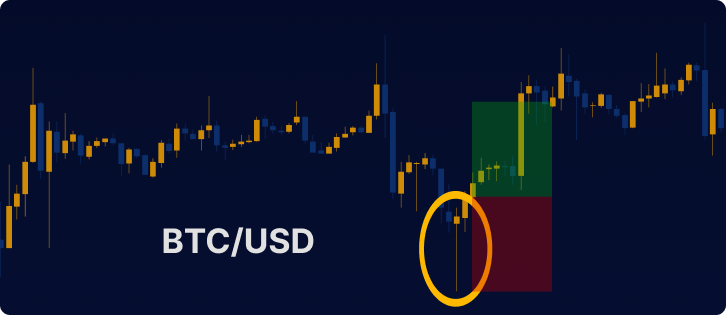
In February 2023, Bitcoin experienced a price drop. Price fell from around $25,000 to around $24,000 in one day. On February 19, 2023, a Dragonfly Doji pattern appeared on the 1-hour chart, indicating a potential bullish reversal. The long position got opened directly after the next hourly candle closed. The stop-loss of the position is below the Dragonfly Doji’s low. The take-profit on a 1:1 risk-reward-ratio. A bullish move followed the pattern, and Bitcoin’s price rose to $25,000 the next day. The long position reached the take-profit.
Example 2 – Ethereum (ETH/USD)
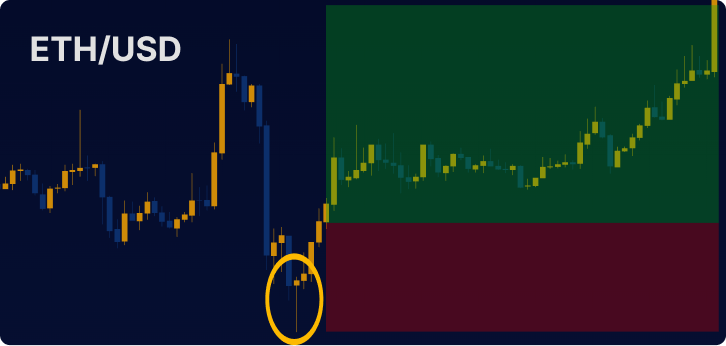
On March 23, 2023, the value of Ethereum dropped from above $1830 to around $1770 within two hours. A Dragonfly Doji candle was shown on the 15-minute chart, signaling a possible shift in trend direction. The trader waits for confirmation of the dragonfly. The confirmation occurred as a break of the latest structural swing high. A long position got opened directly on the next 15-minute candle. The stop-loss is placed below the low of the dragonfly candle and the take-profit above the next swing high. Price hit the take-profit with a 2:1 risk-to-reward ratio on the next day.
Limitations and Risks
While the Dragonfly Doji pattern can be a helpful tool for identifying potential trend reversals, it’s essential to understand its limitations and the risks associated with relying solely on this pattern for trading decisions. No single technical indicator or pattern can guarantee profitable trades, and combining the Dragonfly Doji with other technical analysis tools can increase the probability of successful trades.
For instance, traders can use moving averages, RSI, or MACD to confirm the signals generated by the Dragonfly Doji pattern. Additionally, traders should always practice proper risk management, including setting stop-loss orders, diversifying their portfolio, and only investing what they can afford to lose.
Conclusion
The Dragonfly Doji candlestick pattern is valuable for identifying potential trend reversals in various financial markets. By understanding its characteristics, learning how to trade the pattern effectively, and combining it with other technical analysis tools, traders can increase their chances of success in the markets. As with any trading strategy, practicing proper risk management and performing thorough research before making any trading decisions is essential.
FAQs
Traders can use the Dragonfly Doji uptrend to buy low and potentially profit from a future price increase. When the pattern appears at the end of a downtrend, traders can wait for confirmation before entering a trade and set stop-loss orders to minimize potential losses.
The long lower wick in a Dragonfly Doji pattern indicates that the price has reached its lowest point during that period, and the buyers have taken control, pushing the price back up.
Traders can identify a Dragonfly Doji pattern on a chart by looking for a candlestick with a long lower wick, a small or non-existent upper wick, and a small or non-existent body.
Yes, a Dragonfly Doji candlestick pattern can appear in other financial markets besides cryptocurrency. It is a candlestick pattern that can be used in technical analysis in any market.
The Dragonfly Doji pattern is a reliable indicator of a potential trend reversal. Especially when it appears at the end of a downtrend. However, traders should wait for confirmation before entering a trade. Moreover, traders should always use stop-loss orders to minimize potential losses.


