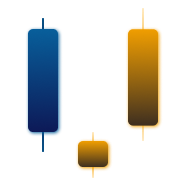
Doji Candlestick Pattern

A Doji candlestick is a single candlestick pattern that occurs when the open and close price of an asset is nearly identical. This results in a candlestick with a very small or non-existent body and long upper and lower wicks. The length of the wicks can vary, and the longer the wicks, the more significant the Doji is considered to be.
Standard
The standard Doji is the most common type of Doji candlestick pattern and occurs when the open and close price of an asset are the same. It has a small or non-existent body and long upper and lower wicks. The standard Doji is a neutral pattern, meaning that it doesn’t indicate a clear bullish or bearish bias.
Long-Legged
The long-legged Doji occurs when the open and close prices of an asset are the same, and the length of the wicks is longer than usual. The long-legged Doji is considered to be a more significant pattern than the standard Doji, indicating indecision in the market.
Dragonfly
The Dragonfly Doji is a bullish doji pattern that occurs when the open and close price of an asset are the same, but the low of the candlestick is significantly lower than the open and close prices. It has a long lower wick and no upper wick. The Dragonfly Doji is called to be a bullish reversal pattern.
Gravestone
The Gravestone Doji is a bearish doji pattern that occurs when the high of the candlestick is significantly higher than the open and close prices. It has a long upper wick and no lower wick. The Gravestone Doji is called a bearish reversal pattern.
How is a Doji Pattern Formed?
A Doji candlestick pattern is formed when the open and close price of an asset are nearly identical. This can occur in a variety of market conditions and can be indicative of different things depending on the context in which it occurs. For example, a Doji may be formed during a period of consolidation when the market is range-bound and there is no clear trend. Alternatively, a Doji may be formed during a period of high volatility when the market is experiencing sharp price swings.
What Does a Doji Candlestick Mean for Traders?
A Doji candlestick can mean different things for traders depending on the context in which it occurs. Generally speaking, a Doji trading indicates indecision in the market and suggests that neither the bulls nor the bears have gained control. It can also be indicative of a potential trend reversal, particularly when it occurs at key support or resistance levels.
When a Doji forms at a key support level, it may suggest that buyers are coming into the market and that a bullish reversal is imminent. Conversely, when a Doji forms at a key resistance level, it may suggest that sellers are coming into the market and that a bearish reversal is imminent.
Traders often look for confirmation of a Doji signal before making a trading decision. This can be done by looking at other technical indicators, such as trend lines, moving averages, or other chart patterns.
One way traders use reversal doji candlestick is as a signal for potential trend reversals. For example, if a market has been in a downtrend, and a Dragonfly Doji forms, it could indicate a potential bullish reversal. Conversely, if a market has been in an uptrend, and a Gravestone Doji forms, it could indicate a potential bearish reversal. However, traders should always be cautious when interpreting candlestick patterns as they can often be misleading.
Another way traders use Doji candlesticks is as a signal for potential price breakouts. When a Doji forms near a support or resistance level, it could indicate that the market is testing that level, and a breakout could occur in the near future. Traders can use other technical indicators to confirm a breakout and make a trading decision based on the direction of the breakout.


