Hammer Candlestick Pattern

Technical analysis is essential for traders and investors looking to make informed market decisions. One of the most popular techniques in technical analysis is candlestick charting. This candlestick analysis visually represents price movements over a specified time frame. The hammer candlestick is a widely recognized pattern that signals a potential price reversal among the various candlestick patterns. Among all candlestick patterns, this is one of the best candlestick patterns. The counter pattern is the shooting star.
Basics of Hammer Candlestick Patterns
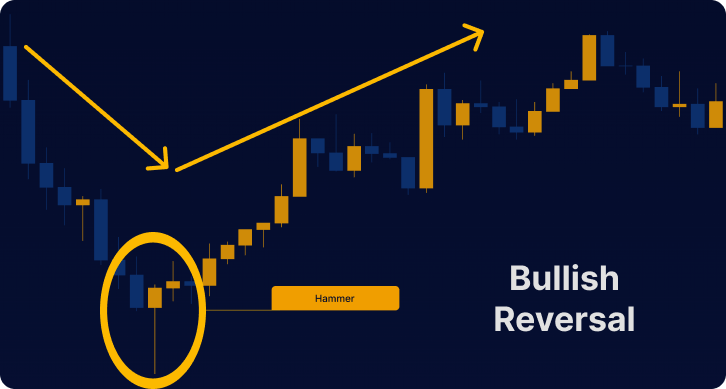
A hammer candlestick formes when a stock or asset’s price falls significantly during the day. But then rallies to close near its opening price. It is characterized by a small body (the rectangular section representing the difference between the opening and closing price) and a long lower shadow at least twice the length of the body.
The long lower shadow of the hammer candlestick pattern indicates that the bears dominated the market. Still, they were not able to keep the price at low levels. The price rallies to close near its opening price. That suggests that the bulls took control by the end of the period. The dominance of the bulls, in the end, prevented a further price decline.
Interpreting a Bullish Reversal Formation
The hammer candle patterns are reversal bullish candlestick patterns, indicating that the market may be reversing from a downtrend to an uptrend. It’s important to note that the pattern does not guarantee a trend reversal. It is best used with other technical analysis tools or COT data to confirm the signal.

Traders and investors analyze the size of the body and shadow to determine the strength of the reversal signal. A larger body with a long lower shadow is a stronger reversal signal. It indicates a more significant amount of buying pressure. On the other hand, a small body with a long shadow may signal a weaker reversal signal, indicating that the bulls and bears are still evenly matched.
Analyzing Hammer Candlestick Patterns
When analyzing hammer candlestick patterns, traders and investors must consider several factors. That helps to interpret the signals and make informed decisions. Factors such as the size of the body and shadow, the time frame, market sentiment, price action, and support and resistance levels all play a role in determining the strength and validity of the pattern. Combining these elements with other technical analysis tools helps to confirm the potential reversal.
Size of Body and Shadow
The size of the body and shadow in a hammer candlestick is vital in determining the strength of the reversal signal. A larger body with a long lower shadow is a stronger reversal signal, indicating a more significant amount of buying pressure.
Time Frame Considerations
The interpretation of a hammer candle pattern may vary based on the time frame it is being analyzed. For example, a hammer candlestick in a daily chart may have a different significance than a hammer in a 4-hour chart. Traders and investors must consider the time frame when analyzing a hammer candlestick pattern. It’s used to confirm the signal online with other technical analysis tools to confirm the signal.
Market Sentiment and Price Action
A hammer candle can provide valuable information about market sentiment and price action if combined with other tools. By analyzing the size of the body and shadow, traders and investors can better understand the underlying market forces and make informed decisions about their trades.
Support and Resistance Levels
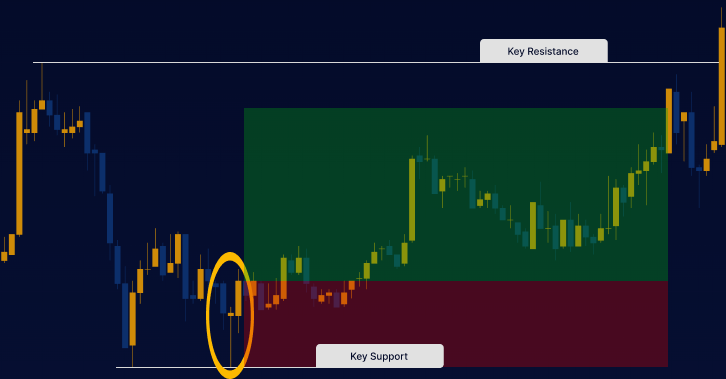
When analyzing a hammer pattern, traders and investors should consider the market’s current support and resistance levels. A hammer candlestick at a key support level may provide a stronger reversal signal. That could be a previous low or a trendline. On the other hand, a hammer candlestick that appears at a key resistance level, such as a previous high or trendline, may provide a weaker reversal signal.

Confirmations and Follow-Through
It’s essential to look for confirmations and follow-through after a hammer candle reversal pattern appears. Confirmations may include other bullish reversal patterns, such as the Bullish Engulfing Pattern or the Piercing Line Pattern. It also contains bullish price action, such as higher lows and higher highs. Follow-through may include a sustained increase in buying volume, an increase in bullish indicators, or a break above key resistance levels.
Developing a Hammer Trading Strategy
To develop a successful hammer trading strategy, follow these specific steps:
- Identify the market context: Look for hammer candlestick patterns in a downtrend or range-bound market, indicating potential trend reversals.
- Confirm the pattern: Use other technical analysis tools for confirmation. Confirmations could be trendlines, support & resistance levels, moving averages, and seasonal movements.
- Assess the pattern’s strength: Analyze the size of the body and shadow to determine the strength of the reversal signal. A larger body with a long lower shadow is a stronger signal.
- Choose the time frame: Select an appropriate time frame for trading, considering that the pattern’s significance may vary depending on the time frame chosen. For example, a daily chart may yield different results than a 4-hour chart.
- Establish entry and exit points: Identify potential entry points near the pattern, such as a break above the hammer’s high, and set a stop loss below the pattern’s low. Determine your profit target and exit strategy based on the market context and your risk tolerance.
- Monitor for confirmations and follow-through: After entering the trade, watch for further bullish price action. Higher lows and higher highs, and additional reversal patterns, like Bullish Engulfing or Piercing Line Patterns. That helps confirm the trend reversal and supports your decision to stay in the trade.
- Manage your risk: Use proper risk management techniques, such as position sizing and stop-losses, to protect your capital and minimize losses if the trade goes against you.
- Review and adjust: Periodically review your trading strategy. Analyze successful and unsuccessful trades to refine your approach and adapt to changing market conditions.
By following these steps and incorporating the hammer candlestick pattern into a comprehensive trading strategy, traders and investors can increase their chances of success and maximize their investment returns.
Conclusion
In conclusion, technical analysts consider the hammer candlestick pattern as a powerful tool and include it among some of the best candlestick patterns. It provides valuable insights into market sentiment and price action, helping traders and investors make informed decisions. By understanding how to interpret the size and shape of the candlestick, considering the time frame, and incorporating the pattern into a comprehensive trading strategy, traders and investors can increase their chances of success and maximize their investment returns.
FAQs
To trade hammer candlestick patterns, look for them in a downtrend or range-bound market, confirm the pattern with other technical analysis tools, identify a potential entry point, set a stop loss, monitor for confirmations and follow-through, and exit the trade when the market sentiment or price action changes or your profit target hit.
Hammer Candlesticks are used to confirm a reversal signal. Traders and investors analyze the size of the body and shadow to determine the strength of the reversal signal and make informed trading decisions.
Yes, hammer candlesticks appear in any market, whether a stock, forex, commodity, or cryptocurrency. However, the pattern interpretation may vary based on the market and the time frame it is being analyzed.
The interpretation of a hammer candle pattern may vary based on the time frame it is being analyzed. For example, a hammer candlestick in a daily chart may have a different significance than a hammer in a 4-hour chart.
Yes, hammer candlesticks, when used in combination with other technical analysis tools, can provide valuable information about market sentiment and price action.


