Inverted Hammer Candlestick Pattern

Candlestick patterns are essential tools in technical analysis that traders and investors use to identify potential market trends and reversals. Among these patterns, the hammer candlestick pattern is particularly well-known for its impactful implications. A variation of this pattern, the inverted hammer candlestick, can be equally potent in signaling bullish reversals.
Basics of Candlestick Charts
Candlestick charts visually represent price movements over a specified period, making it easier for traders to analyze market trends. Each candlestick displays the opening, closing, highest, and lowest prices during a trading session. The body represents the range between the open and close price. The shadows (or wicks) indicate the highest and lowest prices reached.
Importance of Candlestick Patterns in Technical Analysis
Candlestick patterns help traders and investors identify potential market sentiment and price direction shifts. By recognizing these patterns, market participants can make more informed trading and investment decisions, capitalizing on potential trend reversals or continuations.
Understanding the Inverted Hammer Candlestick Pattern
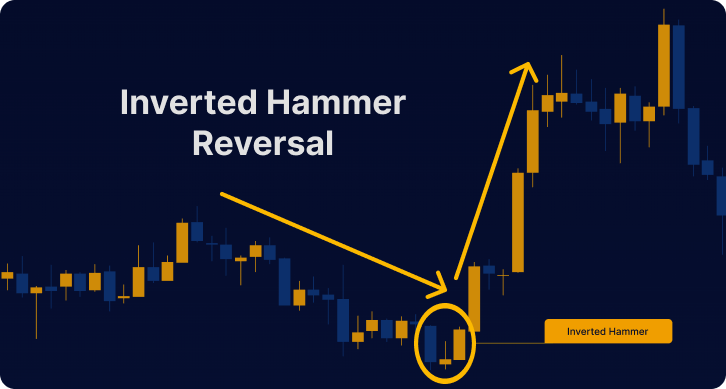
This candlestick pattern is a bullish reversal pattern, indicating that a downtrend is losing strength and a reversal may be imminent.
Characteristics
The inverted hammer is characterized by a small real body at the upper end of the trading range and a long lower shadow, with little or no upper shadow. This pattern forms when a security’s price opens higher than its previous close. Price trades lower during the day but ultimately closes near or above its opening price.
Formation and Significance of the Pattern
The inverted hammer pattern emerges when bears initially drive the price down during the session. However, as the day progresses, they become overwhelmed by the bulls. The presence of a long lower shadow illustrates that sellers significantly pushed the price down throughout the day, but ultimately, the bulls gained control, causing the price to close near its opening level. This shift suggests a potential change in market sentiment from bearish to bullish, rendering the inverted hammer a potent signal for traders and investors.

Trading Strategies with the Inverted Hammer Candlestick Pattern
The signal can be used in several ways in trading and investing. From confirming other technical indicators to identifying potential reversal points.
Using the pattern as a Confirmation Tool
One common approach is to use the inverted hammer as a confirmation tool for other technical indicators. For example, if a trader sees a bullish divergence between the asset’s price and an oscillator like the Relative Strength Index (RSI) and then spots an inverted hammer, this can confirm the bullish bias and signal to enter a long position.
Identifying Potential Reversal Points
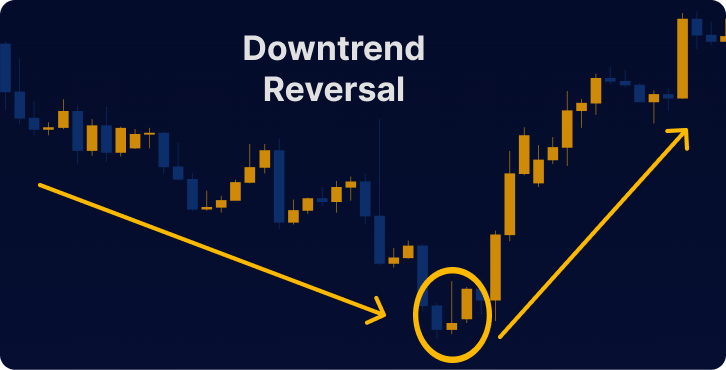
Traders and investors can also use the inverted hammer to pinpoint potential reversal points. If a security has been in a downtrend for some time, and an inverted hammer forms at the bottom of the trend, it can signal that the downtrend may end and a reversal might be impending. That creates an opportunity for traders to enter a long position or for investors to add to their portfolios.
Trade Entry and Exit Points
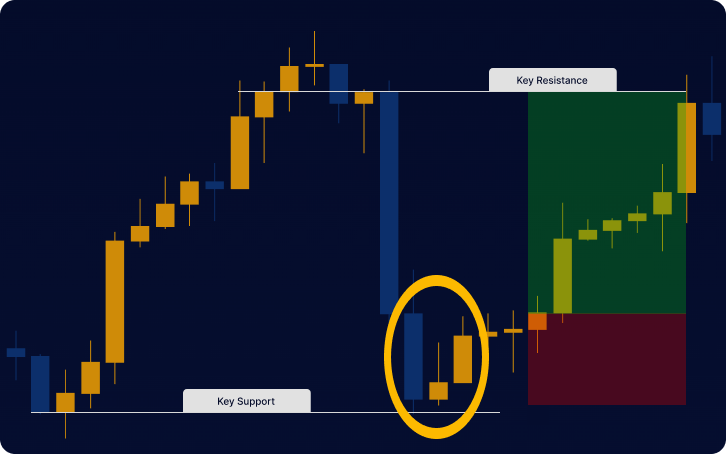
When trading based on the inverted hammer pattern, it’s crucial to determine appropriate entry and exit points. A common approach is to enter a long position once the price breaks above the candlestick’s high. A stop-loss order gets placed below the pattern’s low or at a predetermined acceptable risk level. Profit targets can be set based on previous resistance levels. Additionally, they can be implemented using a risk-reward ratio that aligns with the trader’s overall strategy.
Enhancing the Signal with Additional Technical Indicators
In order to increase the probability of a successful trade or investment, traders and investors can enhance the inverted hammer candlestick by integrating it with other technical indicators, such as support and resistance levels, trend lines, and moving averages.
Support and Resistance Levels
Analyzing support and resistance levels in conjunction with the inverted hammer pattern can provide valuable insights into the strength of the potential reversal. If the pattern forms near a significant support level, it can indicate increased bullish momentum, confirming the reversal signal.
Trend Lines and Moving Averages
Trend lines and moving averages can assist traders in pinpointing the prevailing market trend and potential zones of support or resistance. Should the inverted hammer pattern materialize near a trend line or moving average, it may offer supplementary validation of the pattern’s reliability.
Oscillators and Other Technical Indicators
Oscillators, such as the RSI or the MACD, can help traders identify overbought or oversold conditions in the market. When these indicators align with the inverted hammer pattern, they can confirm the potential reversal, increasing the probability of a successful trade.
Comparing the Inverted Hammer to Similar Candlestick Patterns
Other candlestick patterns share similarities with the inverted hammer, such as the regular hammer and shooting star pattern.
Regular Hammer Pattern
The regular hammer pattern is also a bullish reversal pattern but forms during an uptrend. The hammer has a long upper shadow and a small real body at the lower end of the trading range, with little or no lower shadow.
Shooting Star Pattern
The shooting star is a bearish reversal pattern that forms during an uptrend. The pattern features a small real body at the bottom of the candlestick, accompanied by a long upper shadow and little or no lower shadow. As a result, this pattern signals that the uptrend may lose momentum, indicating that a potential reversal is likely.
Other Reversal Patterns
Traders should also familiarize themselves with other reversal patterns, such as bullish engulfing or morning doji star. These can provide additional confirmation of the inverted hammer’s signal.
Limitations and Considerations
While the inverted hammer is a powerful signal for traders and investors, it could be more foolproof. There are limitations to its effectiveness.
- Reversal signal only: The Inverted Hammer pattern is a reversal pattern. It can only be used to predict a potential reversal in the current trend and not the trend’s direction. For example, if the market is in an uptrend and a pattern forms, it does not necessarily mean it will enter a downtrend. It could also mean that the uptrend may be losing momentum.
- False signals: The Inverted Hammer pattern is not infallible and can sometimes give false signals. Traders and investors should always confirm the pattern with other technical indicators and price action analysis to increase the probability of a successful trade or investment.
- Context is essential: The effectiveness of the Inverted Hammer pattern depends on the market context in which it appears. Traders should consider the overall trend, asset’s historical price behavior and current COT positions.
- Requires confirmation: Although the Inverted Hammer pattern can provide valuable insights, seeking additional confirmation from other technical indicators or chart patterns is essential. That could include bullish divergences, double bottoms, or bullish engulfing patterns.
- Uncertain success: Similar to other technical analysis tools, the Inverted Hammer pattern cannot guarantee success in trading or investing. Employing proper risk management techniques is essential to safeguard your capital. These techniques involve the use of stop-loss orders and appropriate position sizing within your MetaTrader platform.
- Asset class and time frame considerations: The Inverted Hammer pattern is effective for various asset classes and time frames. Its effectiveness may vary depending on the specific market and time frame being analyzed. Traders should be aware of the unique characteristics of the asset class and time frame they are working with, as this consideration is important when using the Inverted Hammer pattern.
Real-World Examples and Case Studies
Studying real-world examples and case studies to understand better how the inverted hammer pattern functions is essential.
Example 1: Inverted Hammer in a Downtrend

In this example, a security has been in a downtrend for several weeks, with lower lows and lower highs forming consistently. An inverted hammer pattern emerges at the bottom of the downtrend, signaling that the bears may be losing momentum. Upon seeing the pattern and confirming it with other technical indicators like support levels and RSI, a trader could enter a long position, anticipating a bullish reversal.
Example 2: Inverted Hammer in a Consolidation Phase

An asset has been trading sideways in a consolidation phase with no clear trend direction. An inverted hammer pattern forms at the bottom of the trading range, near a significant support level. That could signal that the bulls are taking control and that a potential breakout from the consolidation phase is imminent. A trader could use this information to enter a long position with a stop-loss order placed below the support level.
Conclusion
The inverted hammer candlestick pattern is valuable for traders looking to capitalize on bullish reversals. Market participants can make more informed trading and investment decisions by understanding the pattern’s characteristics, formation, and significance. It’s essential to confirm the pattern with other technical indicators. Also, Proper risk management techniques are important to ensure long-term success. By mastering the inverted hammer pattern and incorporating it into a comprehensive trading strategy, traders and investors can enhance their ability to navigate the financial markets and achieve their financial goals.
FAQs
The Inverted Hammer and the Shooting Star are similar patterns. The Shooting Star is a bearish reversal pattern with an uptrend losing momentum and likely reversal. The Shooting Star has a small real body at the bottom of the candlestick, with a long upper shadow and little or no lower shadow.
The Inverted Hammer differs from the regular Hammer pattern; however, both patterns are bullish trend reversal patterns. Despite their similarities, the Inverted Hammer is characterized by a long lower shadow, whereas the Hammer is distinguished by a long upper shadow.
Yes, the Inverted Hammer can be used for short-term trading, as it can provide valuable signals for traders looking to capitalize on short-term price movements.
Yes, the inverted hammer candlestick can be used effectively for all asset classes, as it is a universal technical indicator. It is effective for stocks, forex, crypto, futures, indices and commodities.
No, the inverted hammer candlestick should not be used as a standalone trading strategy but as a confirmation tool for other technical indicators and price action analysis.
Some common chart patterns that can confirm the inverted hammer candlestick pattern include a bullish divergence, a double bottom, or a bullish engulfing pattern.


